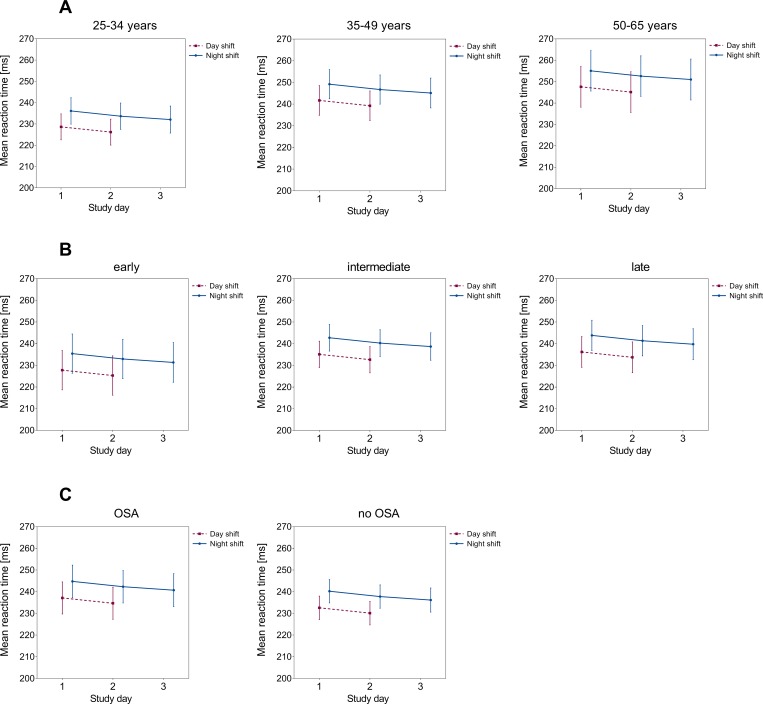
Fig 2.
Mean reaction time and associated 95% confidence intervals according to study day: LS-means stratified by age group (panels A, adjusted for chronotype, OSA, season), chronotype (panels B, adjusted for age, OSA, season), and presence of mild to moderate OSA (panels C, adjusted for age, chronotype, season). The scale of the y-axis does not start at “0”.

