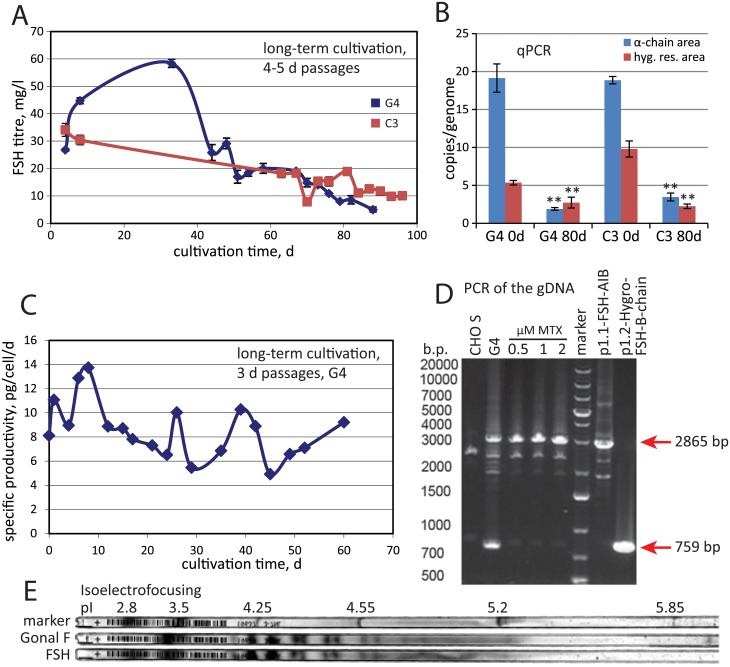
Fig 3. The long-term secretion rate dynamics, genetic stability of the selected clonal cell line and hormone isoforms distribution of the purified FSH.
A—FSH titre dynamics for the long-term cultivation of the G4 and C3 clonal cell lines, 4–5 days passages by ELISA, n = 2. B—qPCR analysis of the expression cassette copy numbers per haploid genome for clonal lines after long-term cultivation. “hyg. res. area”—Hygromycin B resistance gene area, primer pair RT-HYG-F—RT-HYG-R. Error bars represent standard deviation, n = 3. 0d –the first day of cultivation, 80d –samples taken after the 80 days of cultivation. C—Dynamics of the specific productivity of the G4 cell line during long-term cultivation, 3 days passages. D—PCR analysis of the G4 cell line genomic DNA, primers pair SQ-5CH6-F—SQ-3CH1-R. Expected products sizes are depicted by arrows, the image was contrast-enhanced to add visibility. E—Isoelectrofocusing analysis of the purified FSH. Samples were loaded in non-denaturing conditions.

