
Fig. 2. Agarose microchannel scaffold and PCL conduit characterization.
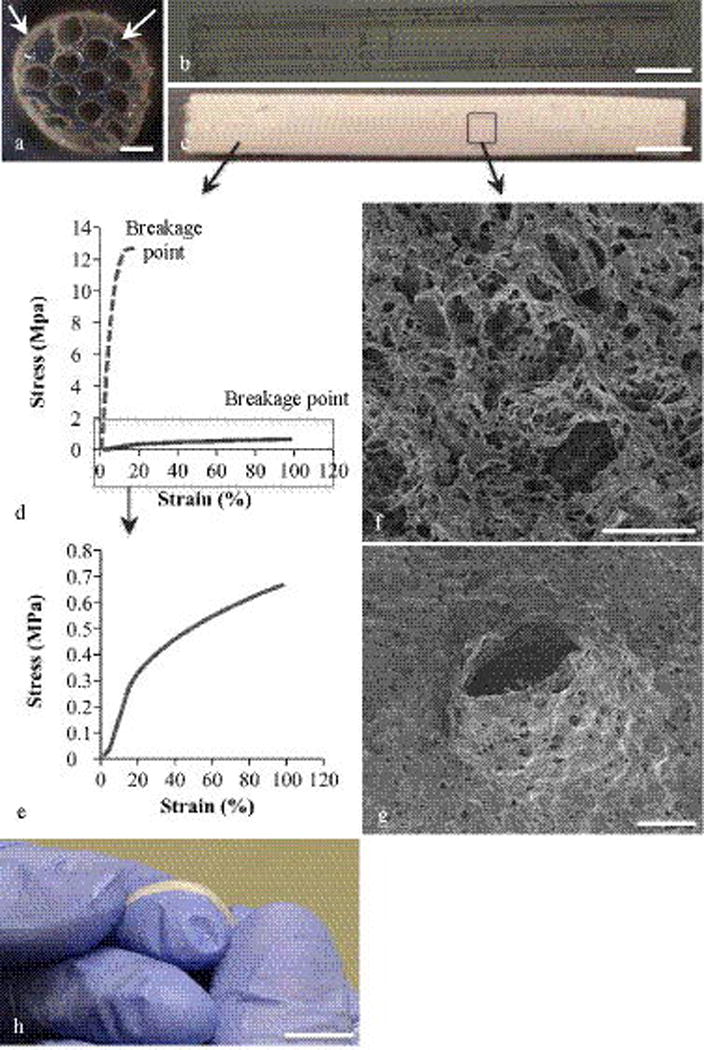
(a) Cross-section of the agarose scaffold shows an array of 300 μm inner diameter channels and 85 μm thick walls. The solid arrow points to the PCL conduit around the agarose scaffold and the dashed arrow points the interstitial channels created by the conduit around the scaffold. (b) The longitudinal view of an agarose scaffold consisted of 10 mm-long linear channels. (c) The longitudinal view of the PCL conduit. (d) The stress-strain behavior of non-porous and porous PCL. The dashed line is the stress-strain curve for 100% non-porous PCL and the solid line is the curve for 70 vol% porosity PCL. (e) The stress-strain behavior of 70 vol% porosity PCL. (f) The SEM image of the PCL fracture surface. (g) The SEM image of a PCL conduit after a simulated in vitro suturing. (h) PCL tube bent around fingertips. The scale bars are as following: (a) is 0.3 mm, (b) and (c) are 10 mm, (f) is 0.02 mm, (g) is 1 mm and (h) is 10 mm.