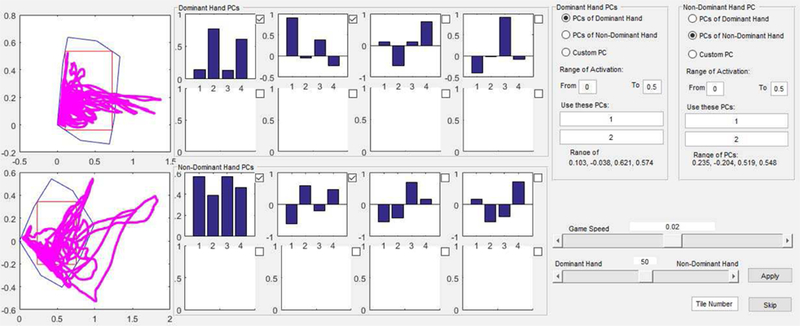
Fig. 2. Graphical user interface for selecting target vectors.
Radio buttons to the right allow selection of target vectors for mapping EMG to the computer screen, either from PCs or from a file or the keyboard. Middle graphs display the PCs computed from the calibration data for the dominant (top) and non-dominant (bottom) hands. Left graphs display the achieved exploration (magenta) within the projection of the hyperplane defined by the selection of the chosen PCs. The polygon (blue outline) shows the projection of the hypercube representing the allowable activation range of each muscle. Through the GUI, one can size the rectangle (red outline) to select the area of the PC-PC plane to be mapped to the computer screen. Slider bar in lower right corner controls relative weighting of EMG signals for bilateral control.

