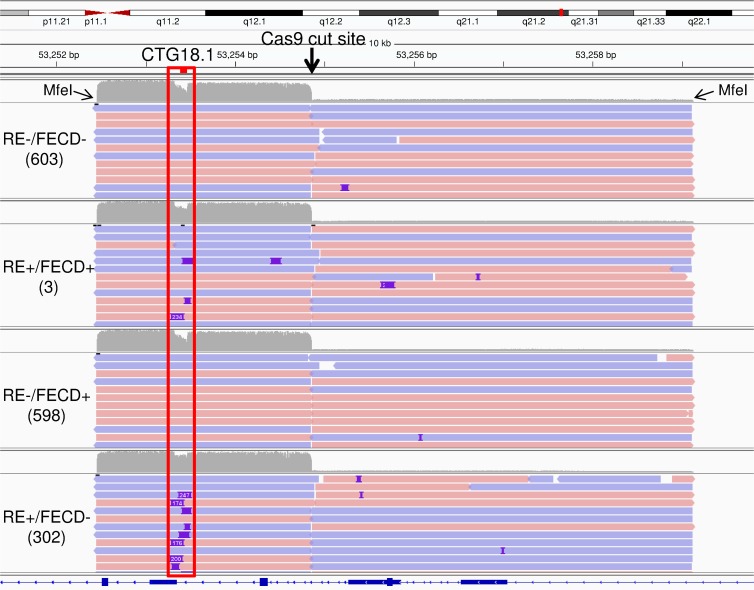
Fig 2. Integrated Genomics Viewer screenshot of a 10kb region surrounding CTG18.1 in the TCF4 gene.
Representative samples from our four classes of FECD and control samples are shown. The location of the CAG repeats is shown by the red bar above the top sequence track. The locations of the flanking MfeI sites are noted, as is the Cas9 cut site. Insertions are shown as blue marks on individual sequence reads.

