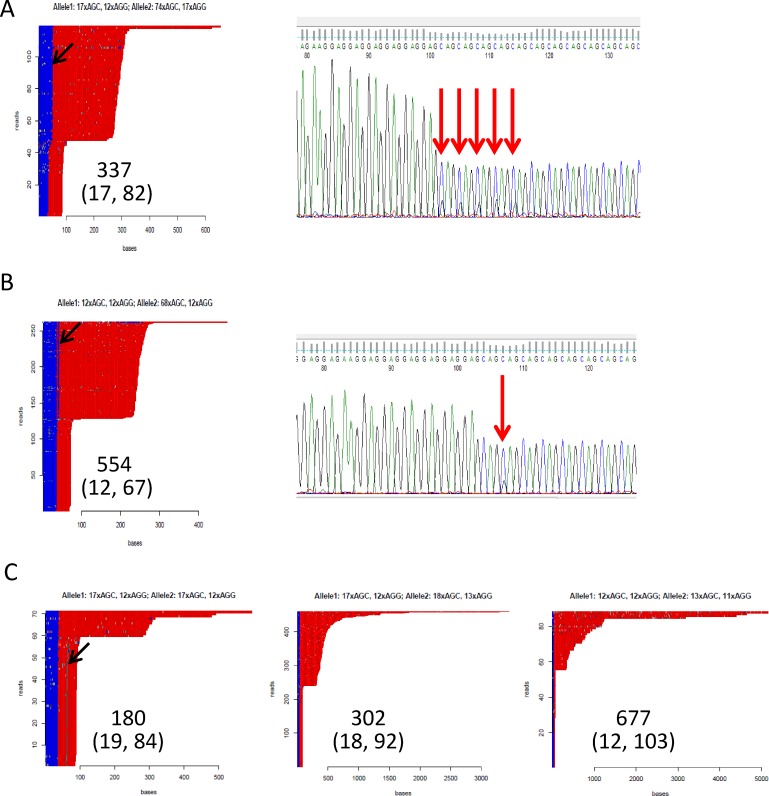
Fig 5. HTT repeat analysis plots for RE+/FECD-.
a. Sample 337 contains an expansion of the AGG tract in the larger allele (black arrow) and Sanger sequencing confirmed sequence differences that extend the AGG repeat (red arrows). b. Sample 554 contains a CAG interruption of the AGG repeats (black arrow) that was confirmed by Sanger sequencing (red arrow). c. HTT repeat analysis for the remaining three RE+/FECD- samples. Sample 180 has an interruption in the CAG repeats in the smaller allele (black arrow), but no additional interruptions in either the AGG or CAG repeats were noted. Note the presence of CAG repeats greater than 4 kb in samples 302 and 677.

