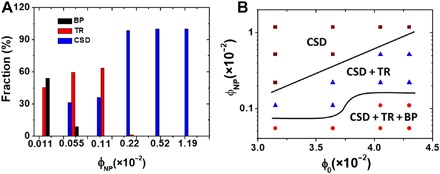
Fig. 3. Analysis of droplet morphologies.

(A) Distribution of the populations of droplets with BP, TR, and CSD assemblies of NPs. For each sample, at least, 300 droplets were analyzed. φ0 = 4.3 × 10⁻² in all the samples. (B) State diagram of the morphologies of NPs in the Ch-CNC droplets.
