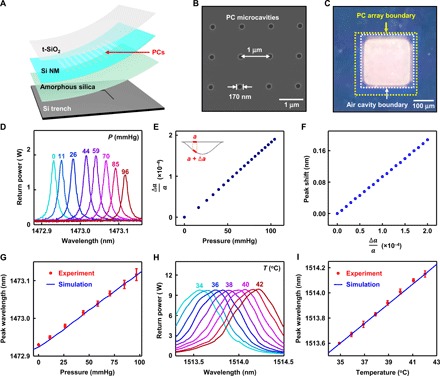
Fig. 2. Materials and designs for bioresorbable PC microcavity-based pressure and temperature sensors.

(A) Schematic illustration of a bioresorbable PC microcavity pressure and temperature sensor, based on a PC structure fabricated in a Si NM, which, together with layers of t-SiO2 for encapsulation, constitutes the diaphragm. The diaphragm seals an air cavity formed by bonding to a silicon substrate with a feature of relief etched into its surface. A layer of amorphous silica serves as an adhesion layer. A free-space detection setup couples light to the top surface of the device. Light delivered to the diaphragm and nondiaphragm regions of the device enables pressure and temperature sensing, respectively. (B) SEM image of PC structure (r = 85 nm, a = 1 μm) fabricated in the Si device layer of an SOI wafer by electron beam lithography. (C) Image of the diaphragm region of the device, illustrating the alignment of the PC cavity array (300 μm by 300 μm; yellow box) in the diaphragm over the trench etched on the silicon substrate (250 μm by 250 μm; white box). (D) Optical spectra collected from the PC pressure sensor placed in air at room temperature under different pressures. The PC resonance peak shifts to the red with increasing pressure. (E) 3D-FEA simulation of the average lattice constant (over the area of a 150-μm-diameter circle) at different pressures. (F) CEM simulation of the shift in the peak wavelength induced by changes in the lattice constant. (G) Calibration curve for the bioresorbable PC pressure sensor (red) compared with simulation data (blue) obtained in (E) and (F). (H) Optical spectra obtained from the PC temperature sensor in air at different temperatures. (I) Calibration curve for the bioresorbable PC temperature sensor (red) compared with optical simulation data (blue). Circles and error bars in (G) and (I) indicate means ± SEM for three measurements.
