(
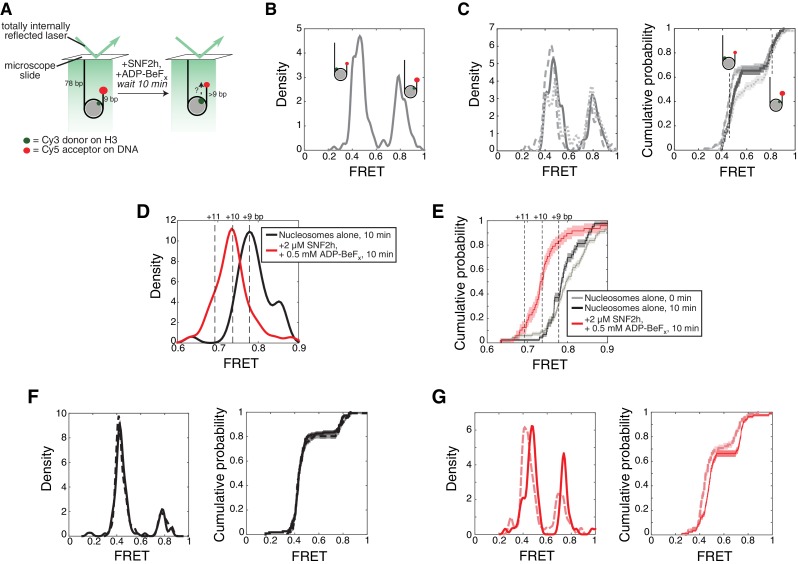
A) Setup of the single molecule assay. Nucleosomes with 78 bp flanking DNA on one side are attached to the surface of a microscope slide and imaged using total internal reflection fluorescence microscopy. The nucleosomes have 9 bp flanking DNA on the other side, with a Cy5 dye at the end of the 9 bp. Movement of the DNA will change the distance between the Cy3 and Cy5 dyes, changing the observed FRET. (
B) Kernel density estimation (KDE) plot of the starting FRET values of 179 nucleosomes, without SNF2h, combined from the three independent replicates shown in (
C). FRET values cluster into two peaks, near 0.8 FRET and 0.45 FRET, corresponding to two possible labeling schemes: a Cy3 dye on the histone H3 closer to the Cy5-labeled DNA end (proximal labeling), or a Cy3 dye on the other copy of histone H3 (distal labeling). As demonstrated in
Zhou et al. (2018), the distally-labeled population is relatively insensitive to changes in the length of the DNA separating the Cy5 from the edge of the nucleosome, and so is not shown in (
D) and (
E). (
C) KDEs (left) and empirical cumulative distribution functions (CDFs; right) of starting nucleosomal FRET values from three independent replicates. Note that the FRET value of the midpoint of a peak in a KDE corresponds to the FRET value where the slope of the CDF is steepest. Thus the distal and proximal peaks in the KDEs appear as two regions of steep slopes in the CDFs. For two data sets with similar peak locations, the FRET value (position along the x-axis) where the slope of the CDF is steepest will be similar. (
D) (black) KDE of FRET values for 43 proximally-labeled nucleosomes after 10 min of incubation without SNF2h, and (red) 48 proximally-labeled nucleosomes after a 10 min incubation in the presence of 2 µM SNF2h and 0.5 mM ADP-BeF
x. Dashed lines labeled ‘+11’, ‘+10’, and ‘+9’ indicate expected FRET values for nucleosomes with 11, 10, or 9 bp of flanking DNA between the Cy5 and the edge of the nucleosome, based on the calibration curve derived in
Zhou et al. (2018). (
E) Empirical cumulative distribution functions (CDFs) of the data in B and C. (
F) Same as (
C) but for the two replicates of nucleosomes alone after a 10 min incubation. The two replicates have 115 and 117 nucleosomes each (with the distally labeled population included). (
G) Same as (
C) but for the two replicates of nucleosomes plus SNF2h and ADP-BeF
x after 10 min. The two replicates have 72 and 83 nucleosomes each. Shaded regions in CDFs in all panels represent an estimate of the error based on a bootstrapping method (
Gamarra et al., 2018;
Zhou et al., 2018).

