. 2019 Jun 18;8:e46057. doi: 10.7554/eLife.46057

Figure 3. Interactions of SNF2h with the histone proteins.

(A) Domain diagram of SNF2h. (B) Conformational changes in SNF2h associated with nucleosome binding. SNF2h is colored according to the domain diagram. The apo structure is the Myceliophtora thermophila ISWI crystal structure (PDBID: 5JXR). (C) Middle. High resolution SNF2h-nucleosome structure from Figure 1 enlarged to show details of the interactions with the histone proteins. Colored in red on SNF2h are the acidic residues contacting the histone H4 tail. Colored in orange, tan, and yellow are the residues mutated in this study. Left. Enlarged to show details of the H4 tail interaction. Right. Enlarged to show details of the H3 core interaction. (D) Native gel remodeling assay of SNF2h constructs. Cy3-DNA labeled nucleosomes were incubated with saturating concentrations of enzyme and ATP and resolved on a native 6% polyacrylamide gel. (E) Quantifications of the data in (D) zoomed on the x-axis to show effects more clearly and fit to a single exponential decay. Un-zoomed plots are in Figure 3—figure supplement 6. (F) Rate constants derived from remodeling assays. Bars represent the mean and standard error from three experiments.

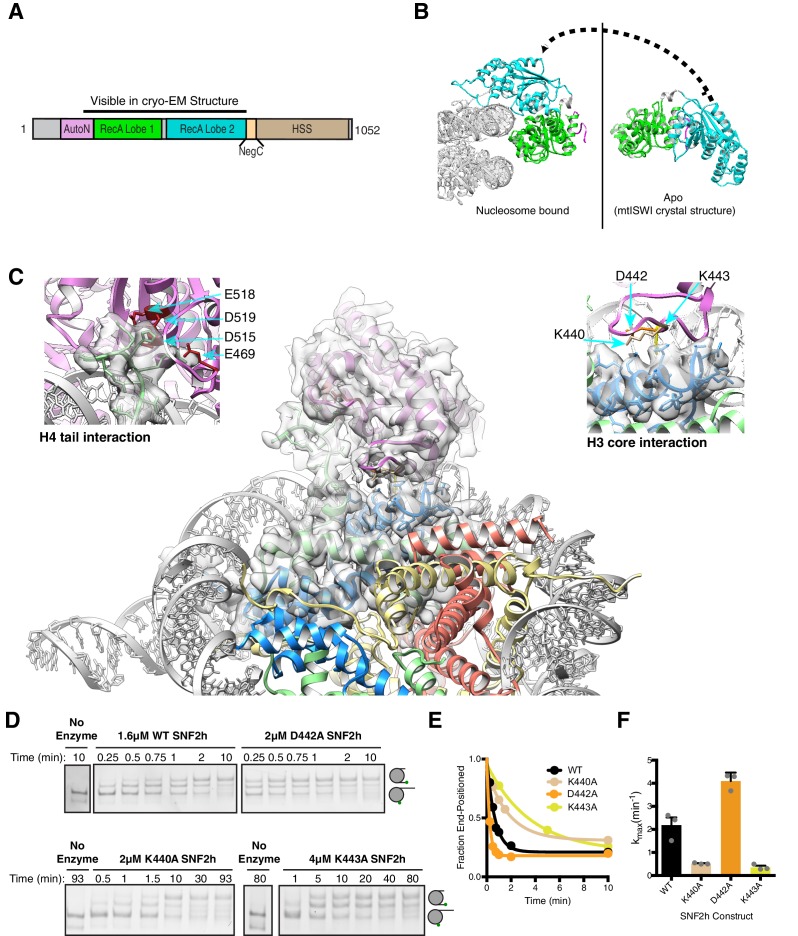
Figure 3—source data 1. Values plotted in E and F.
DOI: 10.7554/eLife.46057.022

Figure 3.

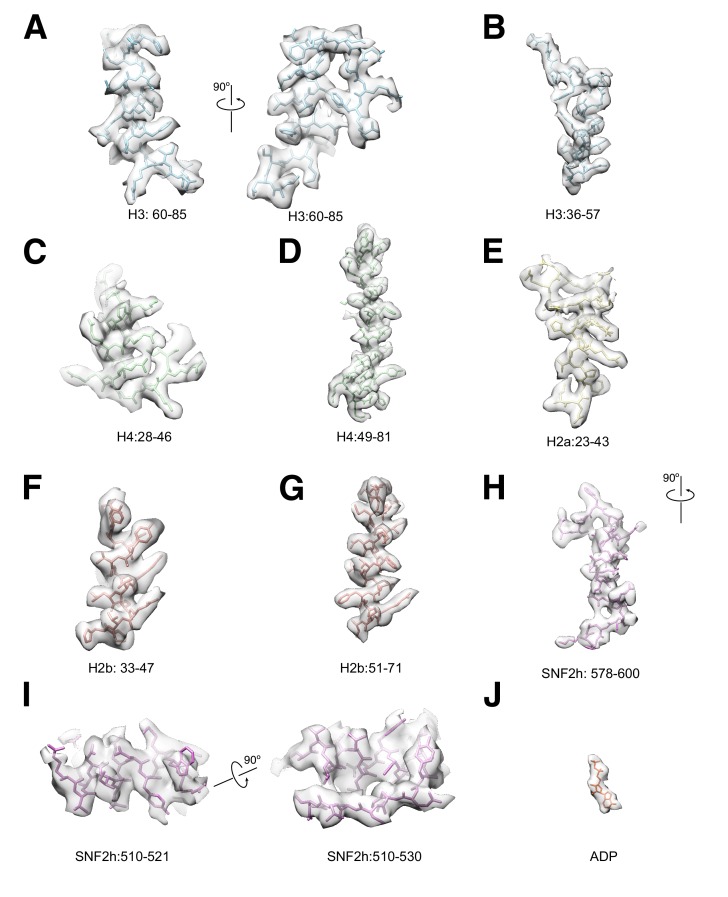
Figure 3—figure supplement 1. Selected Cryo-EM protein densities.

Figure 3—figure supplement 1.

Representative 3.4 Å resolution cryo-EM densities of SNF2h and core histones superimposed on the atomic model. The density maps are shown as semi-transparent, and the model is colored according to the color scheme in the main figures ((A–B) H3: blue, (C–D) H4: green, (E) H2a: yellow, (F–G) H2b: red, (H–I) SNF2h: purple, (J) ADP: orange).

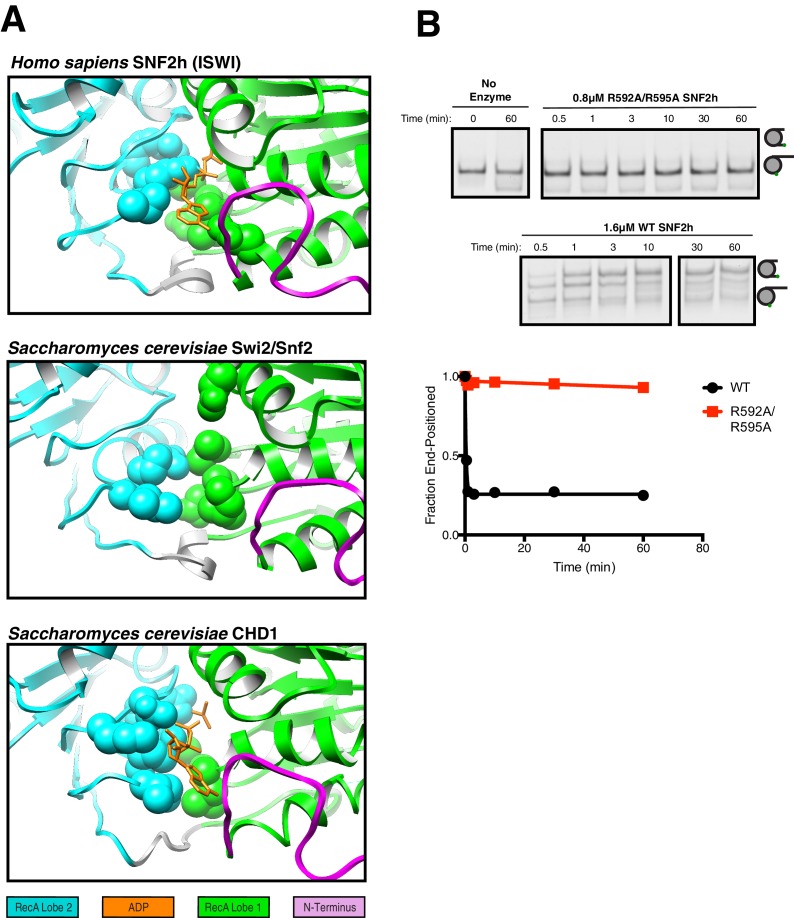
Figure 3—figure supplement 2. Comparison of ATP-binding pockets of SNF2h with CHD1 and Swi2/Snf2 and functional validation of SNF2h ATP-binding pocket.

Figure 3—figure supplement 2.

(A) Top. Close up view of the SNF2h ATP-binding pocket from the 3.4 Å structure with ADP fit in the canonical binding site. Middle. Close up view of the ATP-binding pocket from S. cerevisiae Swi2/Snf2 Cryo-EM structure (Liu et al., 2017). Bottom. Close up view of the ATP binding pocket from S. cerevisiae CHD1 Cryo-EM structure with ADP-BeFx fit in the canonical binding site (Sundaramoorthy et al., 2018). The conserved helicase motif I and helicase motif VI that are required for ATP hydrolysis are shown in space fill. (B) Mutation of the putative arginine fingers to alanine abolishes sliding activity. Top. Native gel remodeling assay with saturating concentrations of SNF2h. Bottom. Quantification of the gel fit to a single exponential decay.

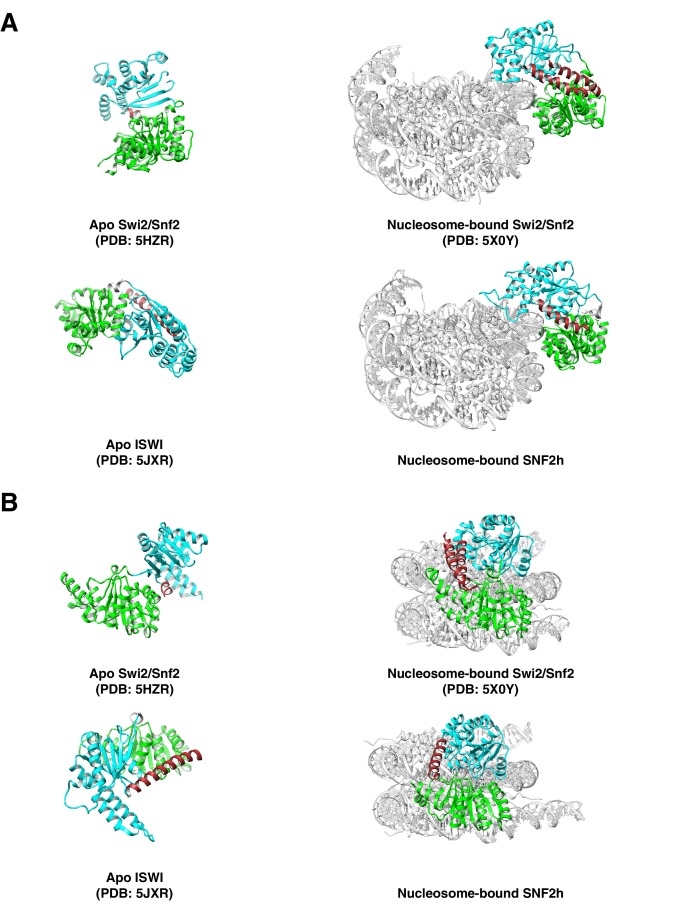
Figure 3—figure supplement 3. Brace helix comparisons.

Figure 3—figure supplement 3.

(A, B). Comparison of bound and unbound conformations of Swi2/Snf2 (top A, (B) and ISWI (bottom A, (B) remodelers in two views. Left: Apo structures of Myceliophthora thermophila Swi2/Snf2 ATPase and ISWI ATPase (Xia et al., 2016; Yan et al., 2016). Right: nucleosome-bound S. cerevisiae Swi2/Snf2 and H. sapiens Snf2h (Liu et al., 2017). Brace helix is shown in brown.

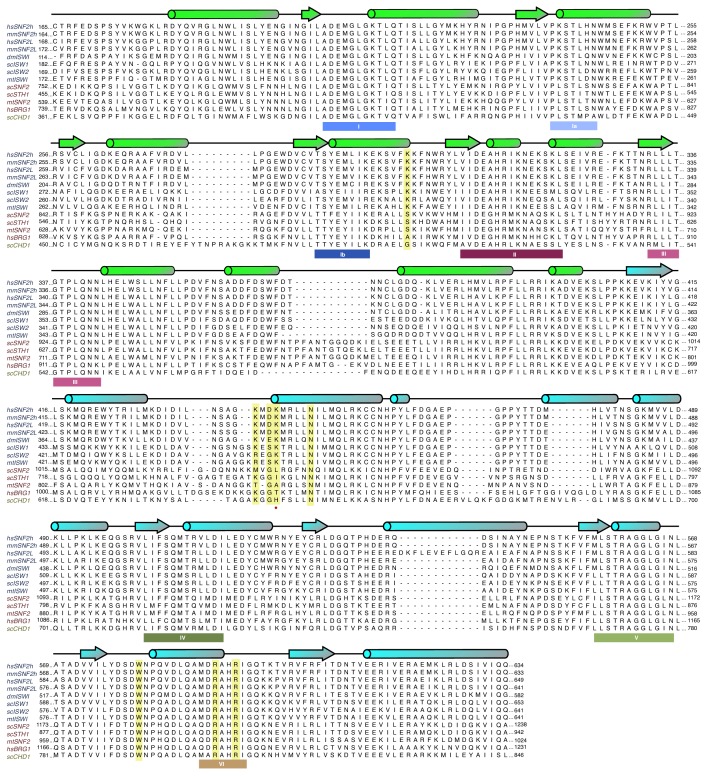
Figure 3—figure supplement 4. Multiple sequence alignment of the ATPase domains of selected members of chromatin remodeling families.

Figure 3—figure supplement 4.

Alignment of the ATPase domains of members of the ISWI (blue), SWI/SNF (red), and CHD families (yellow). Below the sequence, canonical SF2 nucleic acid helicase motifs are annotated (Flaus et al., 2006). Residues mutated in this study are highlighted in yellow. Red (•) denotes K443.

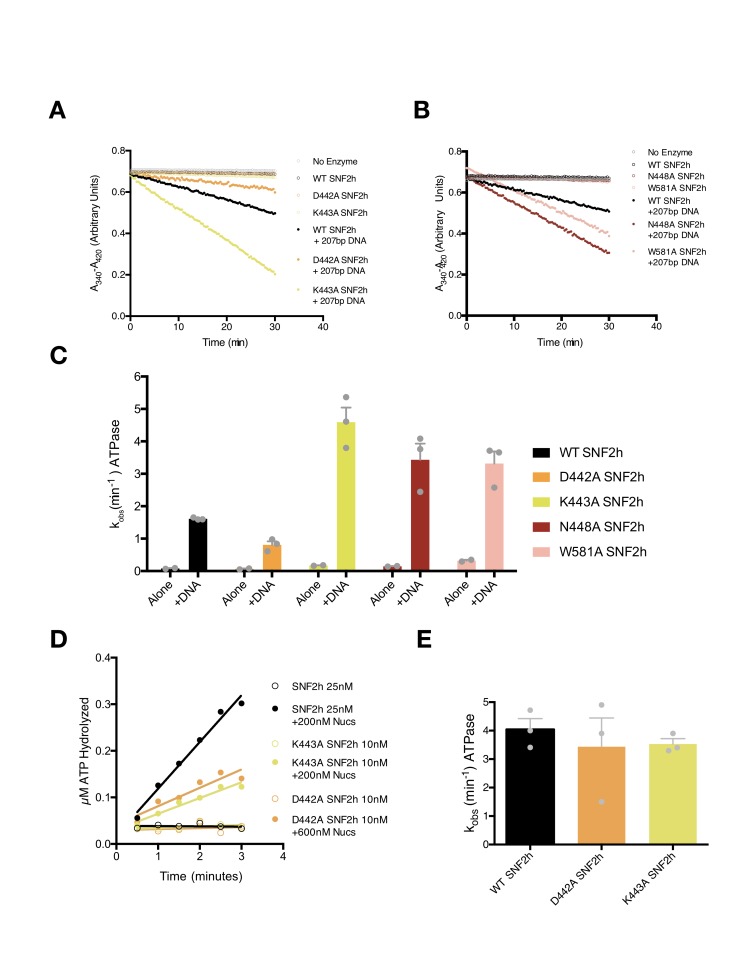
Figure 3—figure supplement 5. ATPase activities of point mutants in this study.

Figure 3—figure supplement 5.

(A–B) Example absorbance plots of the NADH coupled ATPase assay to measure DNA-stimulated ATPase activity. Reactions were performed with 800 nM of the indicated SNF2h constructs either without DNA (open circles) or with saturating concentrations (208 nM) of the 207 bp DNA used to assemble nucleosomes in our Cryo-EM reconstructions. (C) Mean and standard error of DNA-stimulated ATPase rate measurements for n = 3 experiments. All mutations tested had modest effects on DNA-stimulated hydrolysis rates (~2 fold or less). (D) Example plot of radioactive ATP hydrolysis reactions used to measure nucleosome-stimulated ATPase activity. Reactions were performed with the indicated concentrations of SNF2h and nucleosomes without flanking DNA. The concentrations of nucleosomes used were confirmed to be saturating by this assay while the concentration of ATP-MgCl2 used was subsaturating (20 µM). (E) Mean and standard error of nucleosome-stimulated ATPase rate measurements from n = 3 measurements. All rate constants measured were within error of each other.
Figure 3—figure supplement 5—source data 1. Values used to obtain plots.
DOI: 10.7554/eLife.46057.020

Figure 3—figure supplement 6. Full fits of native gel remodeling assays.

Figure 3—figure supplement 6.

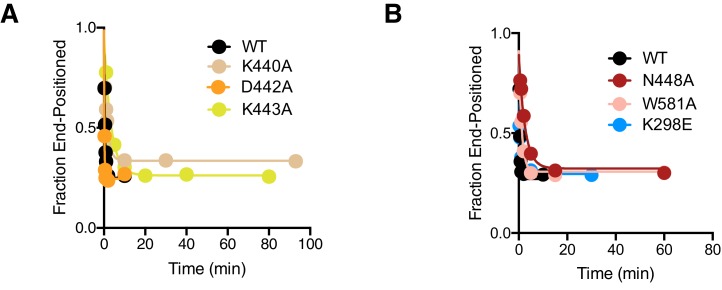
Complete time courses from Figure 3D (A) and Figure 4B (B) shown with longer time points.