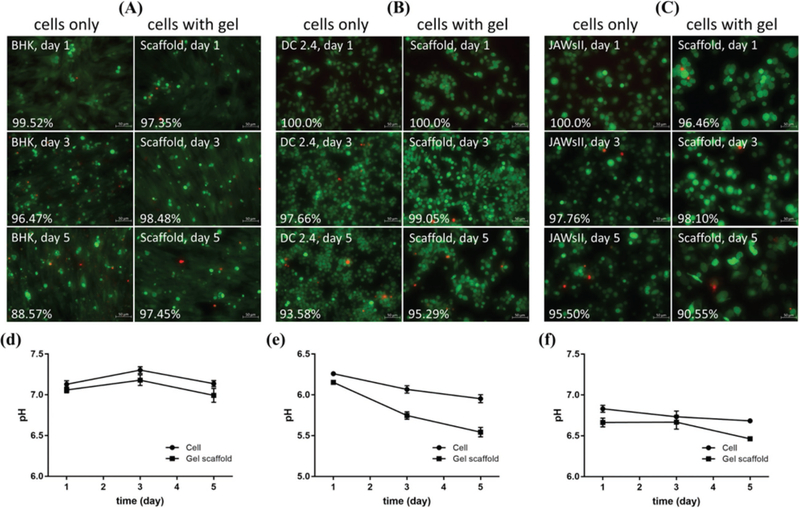
Figure 3.

A) BHK, B) DC 2.4, and C) JAWsII cell viability over time as indicated by Live/Dead assay. Cells were seeded at 150 000 cells well−1 and 50 μL of 10CS/50Alg hydrogel was injected. Pictures of cells only (left) and cells with gel (right) were taken by inverted microscope (20×) at 1 day, 3 days, and 5 days. The number of live and dead cells were counted by ImageJ software; and cell viability were quantified by calculating the percentage of live cells. pH value of BHK D), DC 2.4 E) and JAWsII F) cell culture medium was also monitored at each time point. Scale bar is 50 μm. Results were averages of three independent experiments carried out in triplicate.
