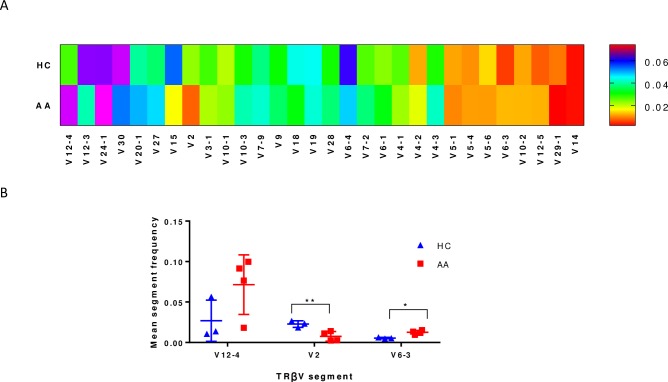
Fig 5. Gene segment usage in TCR of Tregs.
A. frequency of each V segment usage in healthy control (HC) and AA cases, the data represented in the heat map is the mean of three HCs and four AA patients B. Statistical analysis of the observed changes in TCRβV segment usage between HC and AA where the difference was calculated by ANOVA and * P<0.05.

