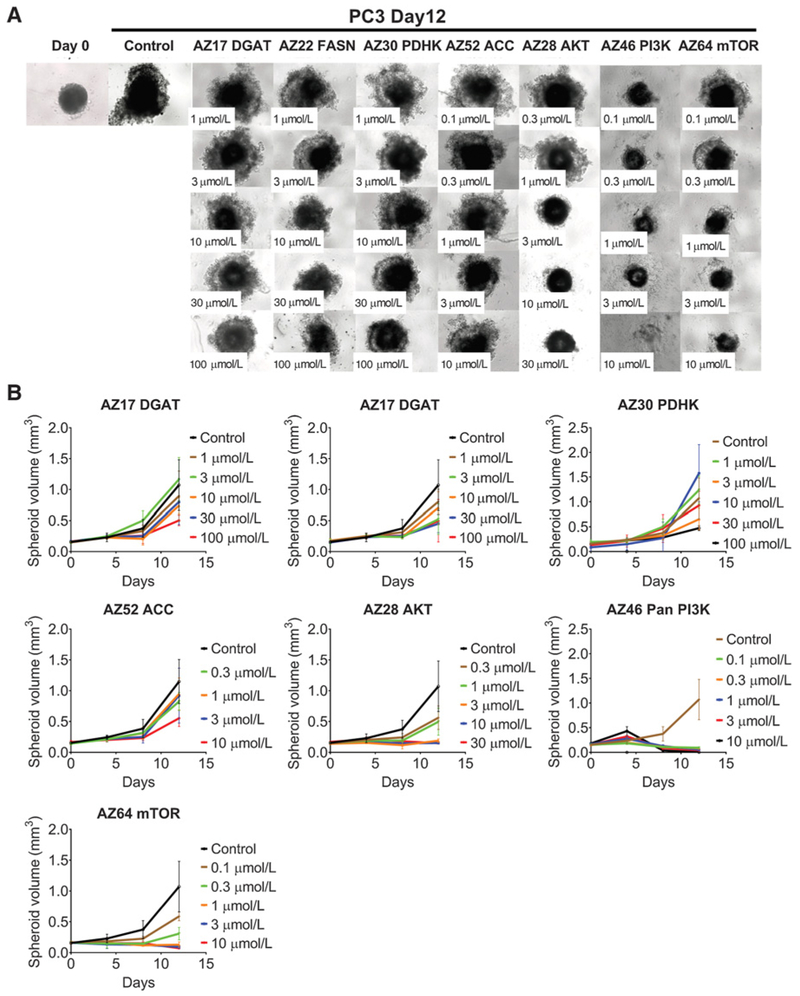
Figure 4.
PC3 spheroid growth inhibition with inhibitors. Microscope images (A) and (B) growth curves of spheroids treated with inhibitors against metabolic enzymes PDHK, ACC, FASN, and DGAT, and kinases PI3K, AKT, and mTOR following 12 days of growth. Between 5 and 15 spheroids were measured per condition, and errors bars represent SD.

