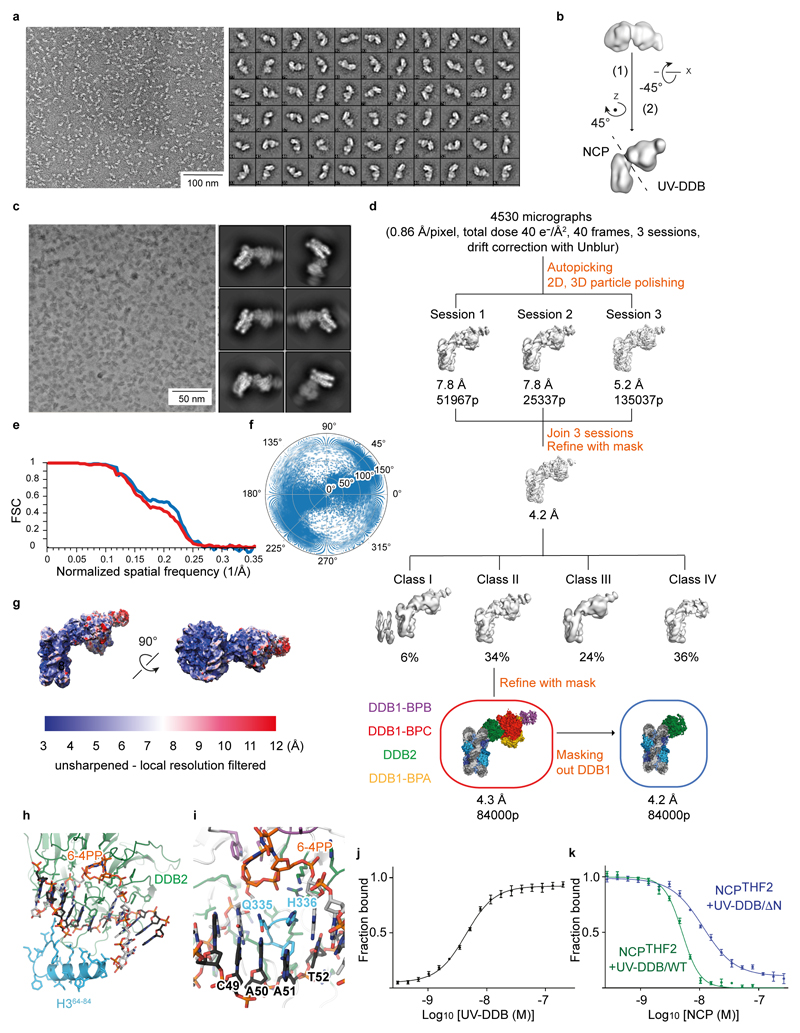
Extended Data Figure 1. Classification and refinement procedures for NCP6-4PP-UV-DDB.
a, Representative negative stain micrograph and reference-free 2D class averages obtained with sxisac.py (SPARX) for the NCPTHF2(-1)-UV-DDB complex. b, Ab initio model generated with sxviper.py in SPARX for the complex shown in a. c, Representative Volta phase plate (VPP) cryo-EM micrographs and reference-free 2D class averages for NCP6-4PP-UV-DDB. d, Classification and refinement procedures for the cryo-EM reconstruction of NCP6-4PP-UV-DDB. Three different microscope sessions (4530 micrographs) were collected under identical imaging conditions and processed independently before merging the best particles to obtain the final high-resolution reconstruction. For each session, a small dataset was manually selected to obtain 2D class averages that were used for particle autopicking with RELION. Several rounds of 2D and 3D classification were necessary to obtain homogeneous datasets. The model shown in b was low-pass filtered to 60 Å and used as initial model for the first round of 3D classification of each session. Given the total dose of 40 e-/Å2 over 40 frames, only frames 1 to 28 were included for movie refinement and particle polishing in RELION. To improve the resolution, the best particles from the three sessions were pooled and subjected to 3D classification into four classes. Refinement of the particles included in class II using a soft mask around the entire complex produced a 4.3 Å resolution map. Refinement of the same set of particles with a soft mask that excluded DDB1 produced a 4.2 Å resolution map. e, Gold-standard Fourier shell correlation curves (FSCs) for NCP6-4PP-UV-DDB (red) and for the same complex after masking out DDB1 (blue). f, Angular distribution of the particles included in the final models. g, Local-resolution filtered map for NCP6-4PP-UV-DDB coloured by resolution (MonoRes47). h, The 6-4PP lesion is located next to H3 α–helix α1. i, Orphaned bases are stabilised by β-hairpin loop insertion. j, Fluorescence polarisation (FP) dose response curves using 10 nM Cy5-labelled 15 bp oligonucleotide with a single THF damage site (Cy5-15-bp-DNATHF) mixed with UV-DDB (0.3 - 200 nM) and the interaction measured and plotted as described in Methods. All data include three technical replicates (n = 3) and are shown as mean ± s.d.. k, 10 nM of a Cy5-15-bp-DNATHF were mixed with 10 nM wild-type UV-DDB or the UV-DDB/ΔN variant lacking residues 1-40 of DDB2, and counter titrated with NCPTHF2(-1). Although the DDB2 N-terminal region (residues 1-40) contributes to nucleosome binding in biochemical assays, we did not find interpretable density for this segment, and also did find evidence of UV-DDB dimerisation in our cryo-EM structures18.

