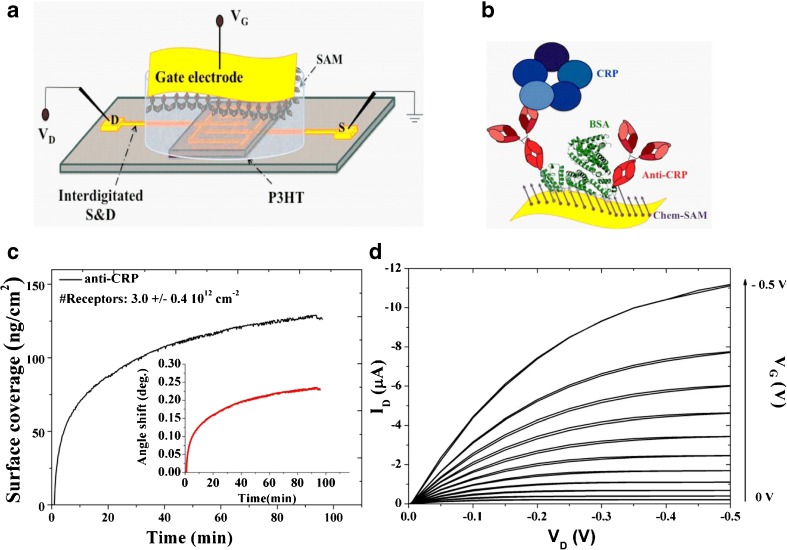
Fig. 1.
a Three-dimensional schematic representation of the developed SiMoT biosensing platform. b Sketch of the capturing SAM, representing both the chem-SAM and the bio-SAM of capturing proteins. c Anti-CRP surface loading vs. time. Inset: corresponding angular response of the binding of the anti-CRP proteins as a function of time. d Typical output curves (ID vs. VD, with VG ranging from 0 to − 0.5 V in steps of − 0.1 V) of the SiMoT device

