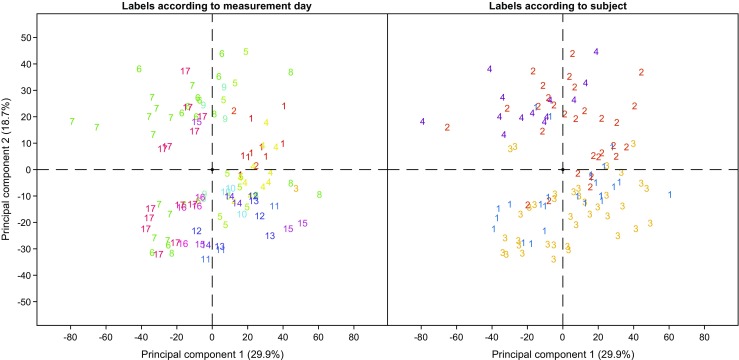
Fig. 5.

Variability of SESI-HRMS breath mass spectra are dominated by inter-individual differences, rather than by batch effect. PCA score plot of all measurements with labels according to measuring day (left) and subject number (right). Grouping according to subject number is more evident than by measurement date.
