Figure 3.

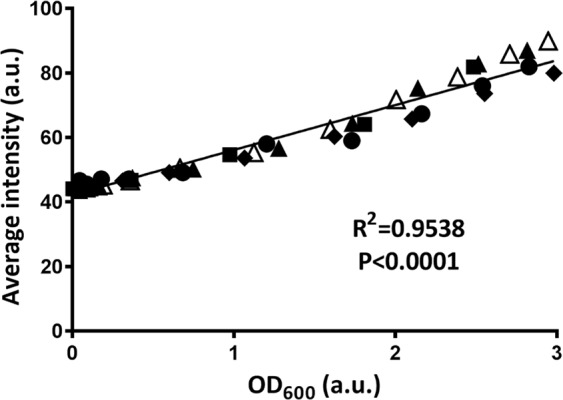
Average intensity (auto-scaled) in OCT images of bacterial suspensions in PBS as a function of the optical density, OD600, of the suspensions. Data involve different concentrations of widely different strains and species (S. epidermidis 252, S. epidermidis ATCC 35984, P. aeruginosa 39324, S. mutans UA159 or S. oralis J22). Different strains are indicated by different symbols, but not further specified due to overlap of data points at similar optical densities. Drawn lines represent the best fit to an assumed linear relation with correlation coefficient R2 and significance of the slope P indicated.
