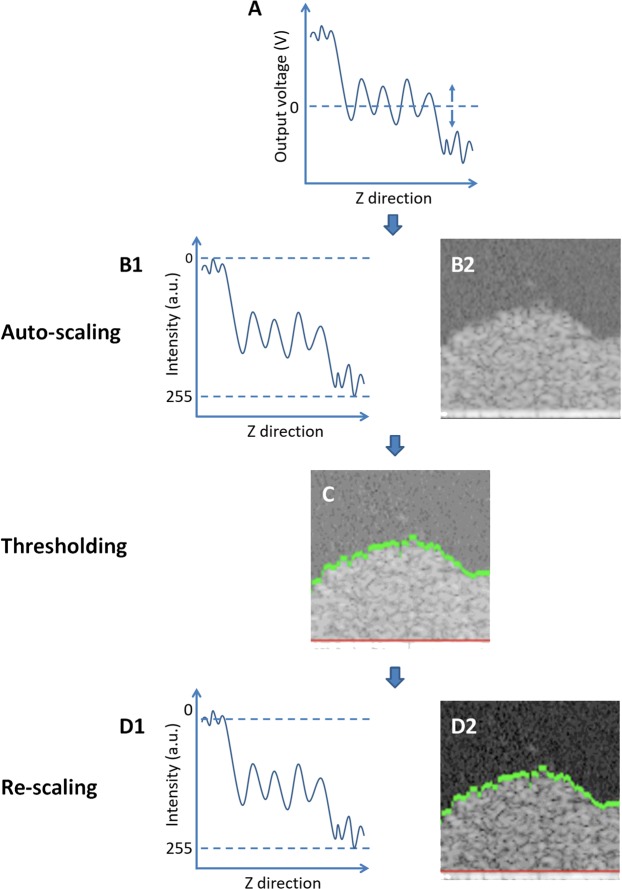
Figure 4.
Auto- and re-scaling based analyses of 2D cross-sectional OCT images. (A) The back-scattered light from the measured sample is collected by the OCT camera and its intensity outputted as analogue voltage. Panel A showed an example of the output voltage in the Z-direction perpendicular to the substrate. Note the OCT adjust the level of zero voltage to ensure zero average output over an entire image. (B) In the subsequent auto-scaling process, voltage is firstly expressed in decibel units with respect to a reference intensity provided by the instruments after which the decibel scale is digitized in 256 discrete values from to 0 and 255 a.u. (panel B1) to yield the image provided in panel B2. Intensity distribution in auto-scaled images is created by the OCT instrument to ensure optimal quality of an individual image. (C) Next, Otsu thresholding17 is applied on the OCT image to determine the biofilm surface (green line), while the substratum surface is visually identified based on the abrupt increase in intensity as compared with the biofilm interior. In order to avoid a potential impact of the intensity of the substratum material on the intensity of the biofilm, for calculational purposes the substratum surface was positioned 3 µm above the visually identified surface (red line). (D) In the proposed re-scaling process of OCT images, the average auto-scaled signal intensity above the biofilm surface, as identified by Otsu thresholding, is given a new intensity value of 0 a.u., while the separately measured, average intensity of a biofilm-free substratum is used and adjusted to an intensity value of 255 a.u. (panel D1). A new OCT image is subsequently generated with the re-scaled signal intensity distribution (panel D2).

