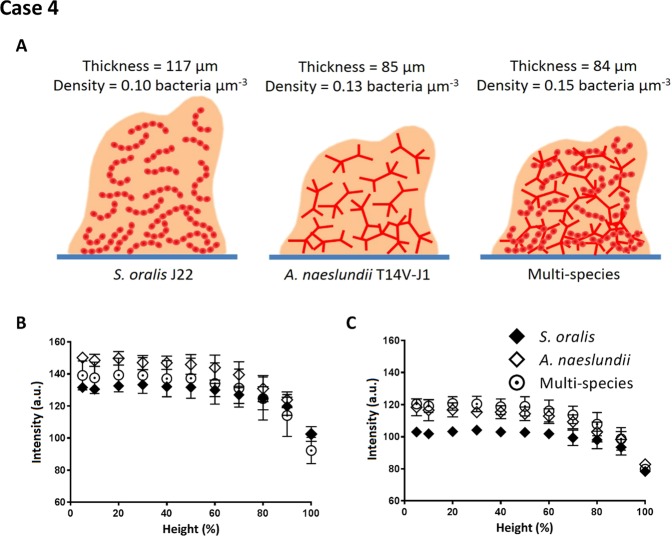
Figure 8.
Signal intensity analysis of OCT images of single-species S. oralis J22 and A. naeslundii T14V-J1 biofilms and multi-species biofilms. (A) Schematic presentation of the biofilms for both single-species and the more compact multi-species biofilms (see Table 1) and measured thickness and volumetric bacterial density. (B) Intensity as a function of biofilm height (%) for both single-species and multi-species biofilms, in auto-scaling analysis. (C) Same as (B), but now in re-scaling analysis. Error bars indicate standard deviations over triplicate experiments with separate bacterial cultures.

