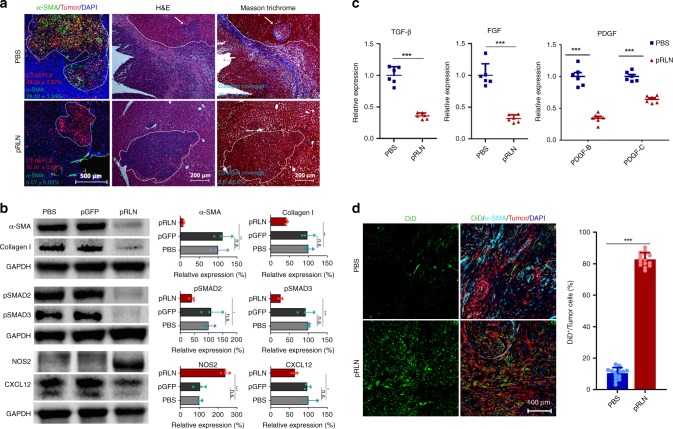
Fig. 3.
RLN gene therapy remodels stromal environment in the metastatic lesion. a α-SMA and collagen downregulation and shrunk metastatic foci 4 days after three pRLN LCP (30 μg pDNA every 2 days) i.v. injections in male mice bearing CT26-FL3 liver metastasis. Immunofluorescence staining of CT26-FL3 metastatic liver from PBS and pRLN treatment groups using anti-α-SMA (green) antibody and DAPI (blue). CT26-FL3 cells were colored red. Numbers in corresponding colors indicate the average % of tumor cells and α-SMA-positive cells quantified in five randomly selected fields per mouse (n = 3). H&E and Masson’s trichrome staining were performed in adjacent sections. White dotted line and arrow indicate the metastatic foci. Bars in the left two, right four panels represent 500, 200 μm, respectively. The average % collagen (blue staining) coverage was calculated in five randomly selected fields per mouse (n = 3). b Western blot analysis of aHSC markers (α-SMA and Collagen I, CXCL12), TGF-β downstream proteins (pSMAD2 and pSMAD3), and NO pathway indispensable protein (NOS2) in CT26-FL3 metastatic livers after RLN gene therapy (n = 3). c Relative mRNA expression of profibrogenic factors (TGF-β, FGF, and PDGF) in CT26-FL3 metastatic livers after RLN gene therapy (n = 6). d Distribution of second-wave nanoparticles (DiD/LCP) in the metastatic liver of mice receiving PBS or RLN gene therapy. Immunofluorescence staining of CT26-FL3 metastatic liver using anti-α-SMA (cyan) and DAPI (blue). DiD/LCP and tumor cells were colored green and red, respectively. % DiD positive signals are normalized by tumor cell occupation in five randomly selected fields per mouse liver (n = 3). Bar represents 100 μm. Significant differences were assessed using t test. Results are presented as mean (SD). *p < 0.05, **p < 0.01, ***p < 0.001, n.s., not significant

