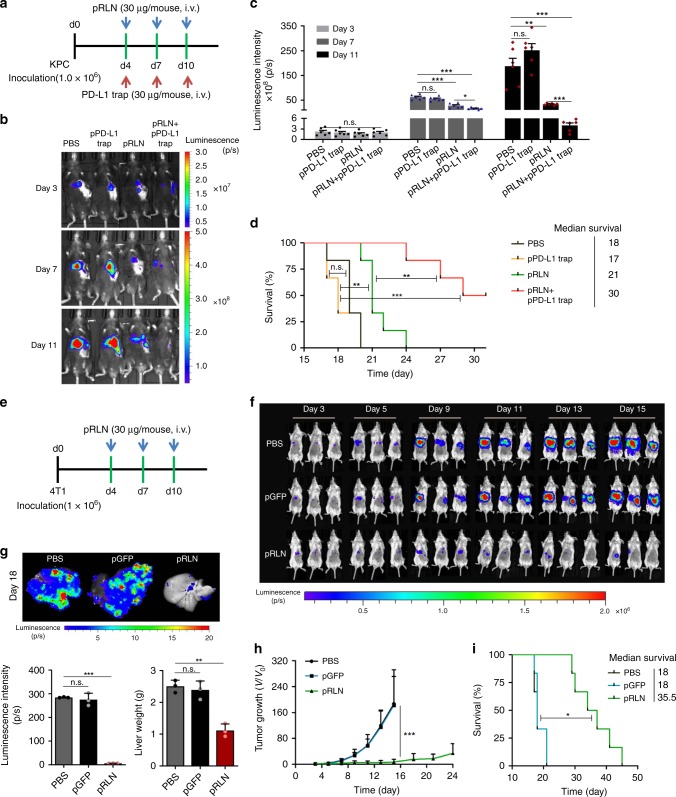
Fig. 6.
RLN and PD-L1 blockade gene-immune therapy on KPC and 4T1 liver metastases. a KPC tumor inoculation and treatment scheme. b Representative in vivo bioluminescence imaging of mice bearing KPC liver metastasis receiving various treatments on days 3,7, 11 post tumor inoculation. c Quantification analysis of KPC liver metastasis burden by bioluminescence intensity (n = 6). d Survival curves of mice bearing KPC liver metastasis in each treatment group (n = 6). e 4T1 tumor inoculation and treatment scheme. f Representative in vivo bioluminescence imaging of mice bearing 4T1 liver metastasis receiving various treatments. g Imaging and quantification analysis (both bioluminescence and liver weight) of ex vivo 4T1 liver metastasis burden from PBS, pGFP LCP, and pRLN LCP 18 days after tumor inoculation (n = 3). h Metastatic growth curves of 4T1 liver metastasis in each treatment group (n = 5). i Mice survival curves in each treatment group (n = 5). Significant differences were assessed in (c, g) using t test, in (h) using two-way ANOVA with multiple comparisons, in (d, i) using log rank test. Results are presented as mean (SD). *p < 0.05, **p < 0.01, ***p < 0.001, n.s., not significant

