Figure 3.
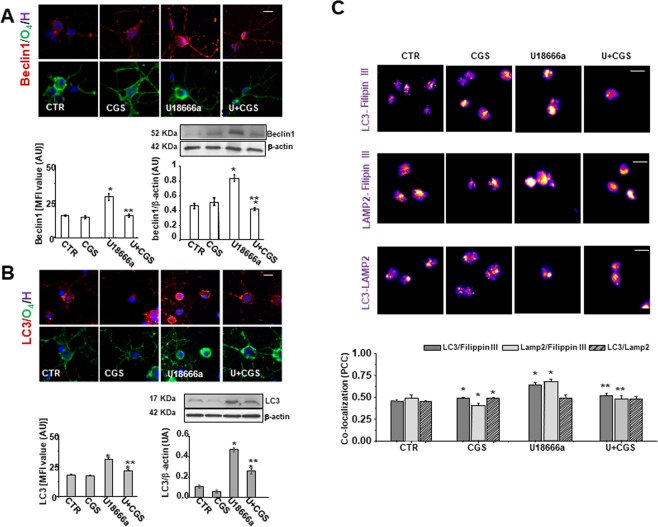
CGS21680 modulates Beclin 1 and LC3 expression, which are upregulated by U18666a and the formation of cholesterol-loaded autophagosome and lysosome. (A,B) OPs treated for 48 h with U18666a (U) and CGS21680 (CGS) were immunostained for Beclin 1 and LC3 as markers of early stages of autophagy. Examples of OPs immunostained with Beclin 1 or LC3 (red) and with O4 (green) are given. Nuclei were stained using the Hoechst 33258 nuclear fluorochrome (blue). Scale bar = 50 µm. Mean fluorescence intensities (MFI value) were shown (data are mean ± SEM of n = 100–150 cells for condition). Western blot analysis of OP cultures treated as before were shown. β-actin expression was used to normalize Beclin 1 and LC3 expression (bar graphs). Representative western blots of three different experiments were shown. Full-length blots are presented in Supplementary Fig. 3S. Data are mean ± SEM (*p < 0.005 vs CTR; **p < 0.05 vs U). (C) After treatment with U and CGS for 48 h, the cells were fixed and labeled with anti-LC3 and Filipin III, anti-LAMP2 and Filipin III and with LAMP2 and LC3. The co-localization between these markers was evaluated. Images represent co-localization maps of red/blue channels using ImageJ software (see Material and Methods section). The degree of co-localization was estimated by Pearson’s coefficient (PCC). Data are mean ± SEM of n. 120–150 cells for each condition, of which it was evaluated co-localization (*p < 0.005 vs CTR; **p < 0.05 vs U. Scale bar = 50 µm).

