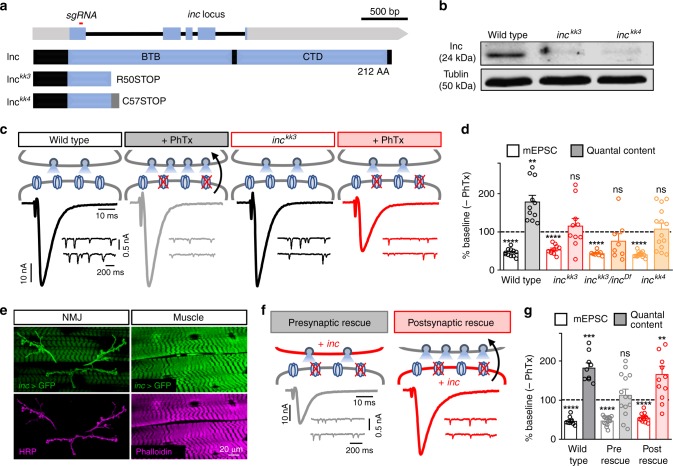
Fig. 2.
inc is required in the postsynaptic compartment to drive retrograde PHP signaling. a Schematic of the Drosophila inc locus, with the region targeted by the single guide RNA to generate the inckk3 and inckk4 alleles shown. (Bottom) Structure of Inc and the predicted structure of the inckk3 and inckk4 mutant alleles. b Anti-Inc immunoblot analysis from whole-adult lysates confirms that both inckk3 and inckk4 are protein null alleles. c Rapid expression of PHP requires inc. Schematic and representative EPSC and mEPSC traces for wild-type (w1118) and inckk3 mutants before and after PhTx application. While mEPSC amplitude is reduced after PhTx application, as expected, inckk3 mutants fail to homeostatically increase presynaptic neurotransmitter release, resulting in reduced EPSC amplitudes. d Quantification of mEPSC amplitude and quantal content values following PhTx application normalized to baseline values (–PhTx) are shown for the indicated genotypes (–PhTx: wild type, n = 17; inckk3, n = 16; inckk3/incDf, n = 10; inckk4, n = 14; + PhTx: wild type, n = 11; inckk3, n = 10; inckk3/incDf, n = 8; inckk4, n = 14). e Representative muscle 6/7 NMJ images of GFP expression driven by the inc promoter (inc-Gal4;UAS-CD4-td-eGFP/ + ). Anti-HRP (neuronal membrane marker) and anti-phalloidin (actin marker) are shown. inc is expressed in both presynaptic motor neurons and postsynaptic muscles. f Schematic and representative EPSC and mEPSC traces in which UAS-smFP-inc is expressed in motor neurons in inc mutant backgrounds (presynaptic rescue: inckk3;OK371-Gal4/UAS-smFP-inc) or muscle (postsynaptic rescue: inckk3;UAS-smFP-inc/ + ;MHC-Gal4/ + ) following PhTx application. Postsynaptic expression of inc fully restores PHP expression, while PHP fails in the presynaptic rescue condition. g Quantification of mEPSC and quantal content values in the indicated genotypes relative to baseline (–PhTx: wild type, n = 10; presynaptic rescue, n = 16; postsynaptic rescue, n = 12; + PhTx: wild type, n = 9; presynaptic rescue, n = 14; postsynaptic rescue, n = 10). Asterisks indicate statistical significance using a Student’s t-test: (**) p < 0.01; (***) p < 0.001; (****) p < 0.0001, (ns) not significant. Error bars indicate ± SEM. n values indicate biologically independent cells. Additional statistical information and absolute values for normalized data can be found in Supplementary Table 2. Source data are provided as a Source Data file

