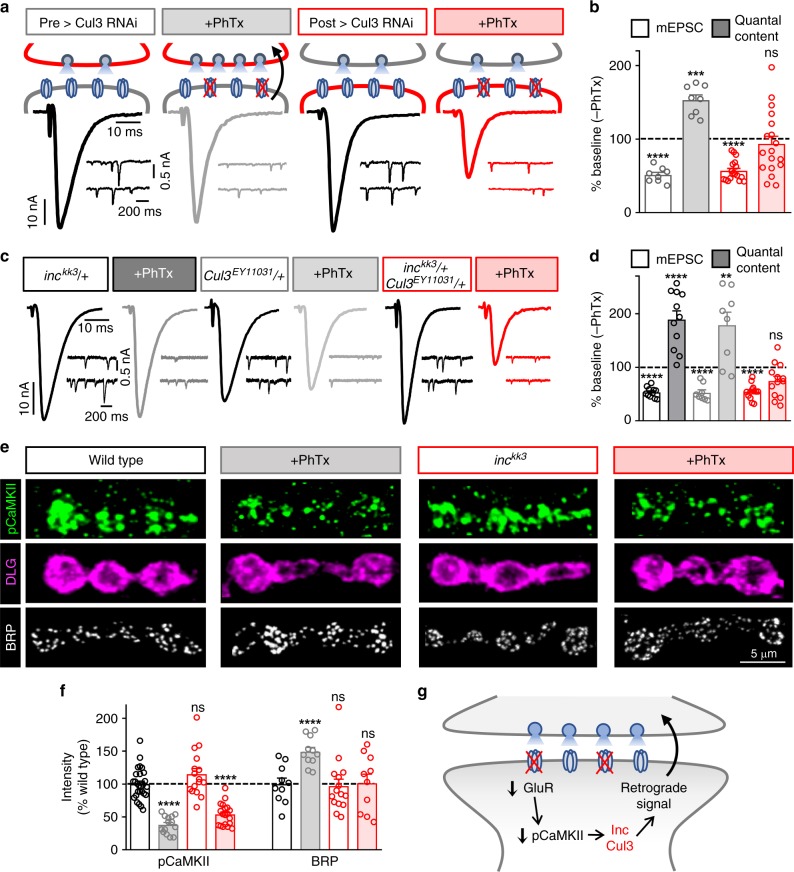
Fig. 3.
inc and Cul3 function downstream of CaMKII but upstream of retrograde PHP signaling. a Schematic and representative EPSC and mEPSC traces from neuronal Cul3 knock down (pre > Cul3 RNAi: UAS-Cul3 RNAi11861R-2/OK371-Gal4) and muscle Cul3 knock down (post > Cul3 RNAi: UAS-Cul3 RNAi11861R-2/ + ;MHC-Gal4/ + ) before and after PhTx application. post > Cul3 RNAi disrupts the expression of PHP, while PHP persists in pre > Cul3 RNAi. b Quantification of mEPSC and quantal content values in the indicated genotypes after PhTx application normalized to baseline values (–PhTx: pre > Cul3 RNAi, n = 8; post > Cul3 RNAi, n = 13; + PhTx: pre > Cul3 RNAi, n = 8; post > Cul3 RNAi, n = 18). c Representative traces from the indicated genotypes and conditions showing a trans-heterozygous genetic interaction between inc and Cul3 in PHP expression. While PHP is robustly expressed in inckk3/ + or Cul3EY11031/ + alone, PHP is completely blocked in the trans-heterozygous condition. d Quantification of mEPSC and quantal content values after PhTx application normalized to baseline values (–PhTx: inckk3/ + , n = 11; Cul3EY11031/ + , n = 8; inckk3/ + ; Cul3EY11031/ + , n = 11; + PhTx: inckk3/ + , n = 11; Cul3EY11031/ + , n = 8; inckk3/ + ; Cul3EY11031/ + , n = 14; Student’s t-test). e Representative NMJ images of wild-type and inc mutants immunostained with anti-pCaMKII (active phosphorylated CaMKII), -DLG (Discs Large; postsynaptic density marker) and -BRP (Bruchpilot; presynaptic active zone marker) before and after PhTx application. A similar reduction in pCaMKII levels are observed following PhTx application in both wild-type and inc mutants. In contrast, BRP levels are increased after PhTx application in wild type, but do not change after PhTx application to inc mutants, consistent with a lack of retrograde PHP signaling and expression. f Quantification of pCaMKII mean fluorescence intensity and BRP puncta sum intensity after PhTx application relative to wild-type values in the indicated genotypes (pCaMKII: –PhTx: wild type, n = 27; inckk3, n = 16; + PhTx: wild type, n = 14; inckk3, n = 19; BRP: –PhTx: wild type, n = 10; inckk3, n = 15; + PhTx: wild type, n = 11; inckk3, n = 10; one-way ANOVA). g Schematic illustrating postsynaptic Inc and Cul3 signaling in the induction of retrograde PHP expression. Asterisks indicate statistical significance: (**) p < 0.01; (***) p < 0.001; (****) p < 0.0001, (ns) not significant. Error bars indicate ± SEM. n values indicate biologically independent cells. Additional statistical information and absolute values for normalized data can be found in Supplementary Table 2. Source data are provided as a Source Data file

