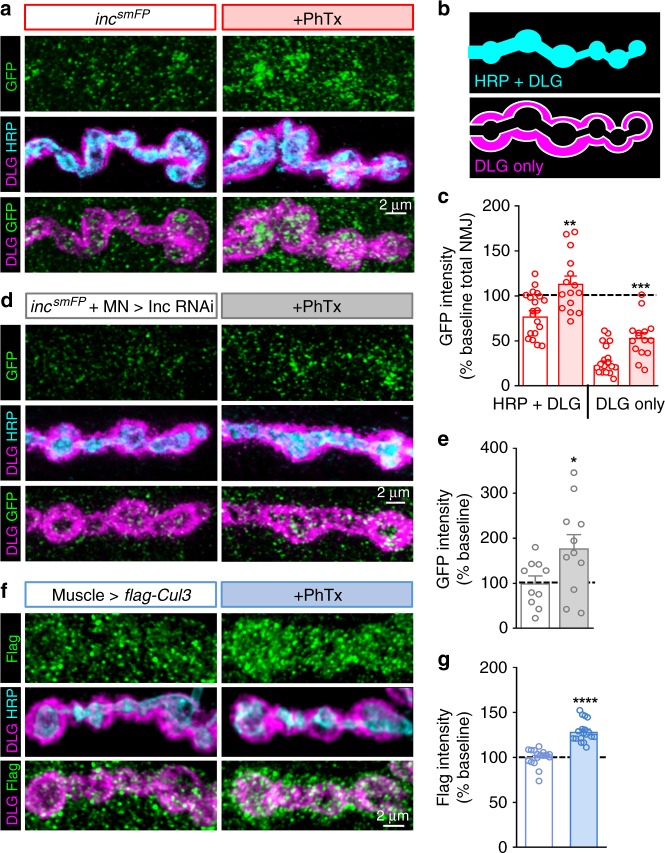
Fig. 4.
Inc and Cul3 levels are rapidly enhanced at postsynaptic densities following glutamate receptor perturbation. a Representative NMJ image of endogenously tagged IncsmFP before and after PhTx application. NMJs are immunostained with anti-GFP (IncsmFP), the presynaptic membrane marker HRP, and the postsynaptic density marker DLG. Note the increase in IncsmFP levels at NMJs (labeled by HRP and DLG). b Schematic illustrating the HRP + DLG signal (where IncsmFP overlaps in both pre- and postsynaptic areas) and the DLG only component (where only postsynaptic IncsmFP overlaps with DLG). c Quantification of IncsmFP intensity at specified areas following PhTx application relative to baseline (–PhTx) (–PhTx: incsmFP, n = 21; + PhTx: incsmFP, n = 15). d NMJ image of endogenously tagged IncsmFP with inc expression knocked down in the presynaptic motor neuron using Inc-RNAi (incsmFP/Y;OK6-Gal4/UAS-inc RNAi) before and after PhTx application. Note that while the IncsmFP signal that overlaps with HRP is reduced by 52% (Supplementary Table 2), a significant increase in the total level of IncsmFP at the NMJ is observed. e Quantification of IncsmFP intensity at NMJs in presynaptic inc knock down following PhTx application relative to baseline (–PhTx) (–PhTx: incsmFP + MN > Inc RNAi, n = 10; + PhTx: incsmFP + MN > Inc RNAi, n = 11). f NMJ image of a Flag-tagged Cul3 transgene expressed in the postsynaptic muscle (G14-Gal4/UAS-3xFlag-3xHA-Cul3) before and after PhTx application. Note that Cul3 signals are enhanced at NMJs following 10 min PhTx application. g Quantification of Flag (Cul3) intensity at PSDs (labeled by DLG) following PhTx application relative to baseline (–PhTx) (–PhTx: muscle > flag-Cul3, n = 19; + PhTx: muscle > flag-Cul3, n = 18). Asterisks indicate statistical significance using a Student’s t-test: (**) p < 0.01; (***) p < 0.001; (****) p < 0.0001, (ns) not significant. Error bars indicate ± SEM. n values indicate biologically independent cells. Additional statistical information and absolute values for normalized data can be found in Supplementary Table 2. Source data are provided as a Source Data file

