Fig. 1.
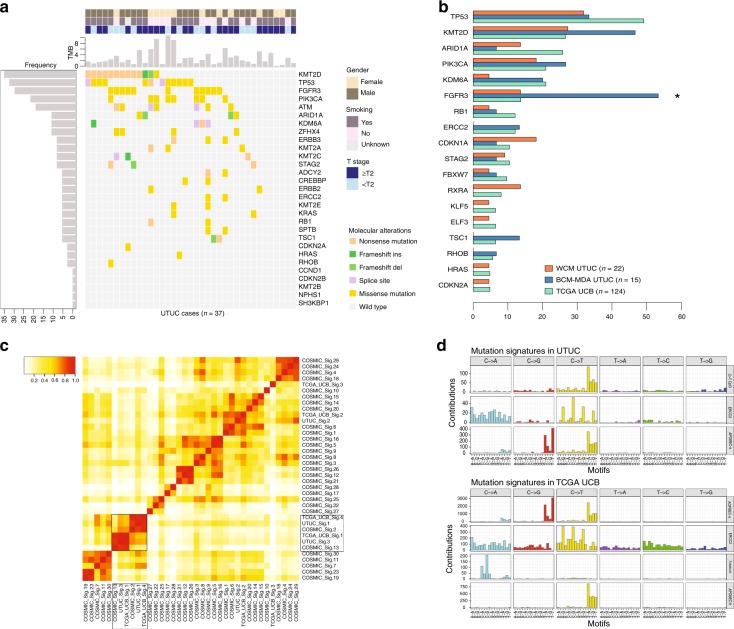
Genomic differences between upper tract urothelial carcinoma (UTUC) and urothelial bladder carcinoma (UCB). a Prevalence of frequent somatic genomic alterations in 37 patients with UTUC from the Weill Cornell Medicine (WCM UTUC) and Baylor College of Medicine–MD Anderson Cancer Center (BCM–MDACC UTUC) cohorts. The somatic mutational rate for each tumor is represented by vertical barplots (total number of non-silent mutations per megabase (MB)). Patient and tumor characteristics are represented on the top right. b Horizontal barplot showing differences in mutational frequencies between WCM UTUC (orange bars), BCM-MDA UTUC (blue bars), and TCGA UCB (green bars) cohorts for frequently mutated genes. Asterisk indicates statistically significant changes in paired comparison between BCM-MDA UTUC and TCGA UCB (*Fisher’s Exact test P = 0.001). c Heatmap of a cosine similarity matrix of COSMIC mutational signatures and observed mutational signatures in UTUC (WCM, BCM-MDA) and TCGA UCB cohorts. UTUC signature clusters with COSMIC signatures 2, 13 (APOBEC-associated). d Dominant mutational signatures in UTUC (top panel) include the C>T CpG signature, attributable to mutagenesis via defective mismatch repair (MMR) (COSMIC signature 6), the ERCC2 signature, consistent with COSMIC signature 5, and the APOBEC signatures (COSMIC signatures 2 and 13) resulting from the endogenous cytidine deamination induced by the APOBEC3 enzyme family. TCGA UCB mutational signatures are shown for comparison (bottom panel)

