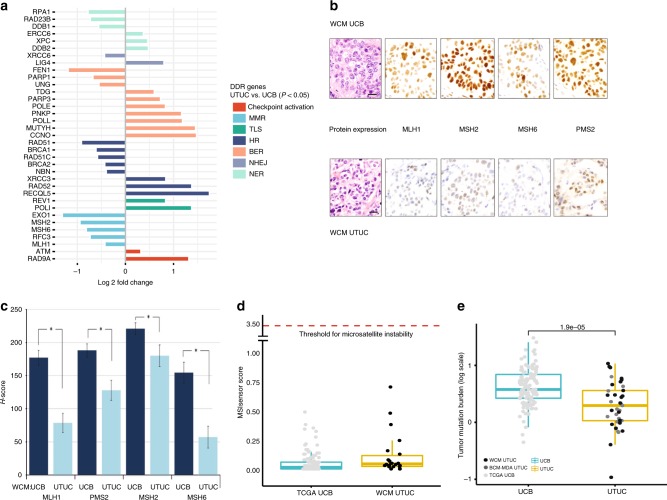
Fig. 2.
UTUC is characterized by decreased expression of canonical MMR proteins. a Comparative histogram of DNA damage response (DDR) genes with statistically significant differential expression (log2 fold) highlighting significantly lower expression of mismatch repair (MMR) pathway genes (MLH1, MSH2, MSH6, RFC3, EXO1) in WCM UTUC compared to TCGA UCB (one-way ANOVA log2FC adjusted P ≤ 0.05). b Representative micrographs (magnification ×400) showing lower expression of MMR proteins in a UTUC tumor compared to a UCB tumor by immunohistochemistry. Scale bars represent 25 µM. c Mean H-scores of MMR proteins are significantly lower in WCM UTUC tumors compared to WCM UCB tumors. Error bars show standard deviation (S.D.) for each MMR protein. Asterisks indicate statistically significant changes in paired comparison (t-test P < 0.05). d Mean microsatellite instability (MSI) score is below the threshold of 3.5 in both WCM UTUC and TCGA UCB tumors. e Mean total mutational burden (TMB), expressed in log scale is lower in UTUC (WCM, BCM-MDA) compared to TCGA UCB tumors (Mann–Whitney test P = 1.9 × 10⁻⁵). The horizontal lines within the boxes in the boxplots indicate the mean, boundaries of the boxes indicate the 25th-percentile and 75th-percentile, and the whiskers indicate the highest and lowest values of the results

