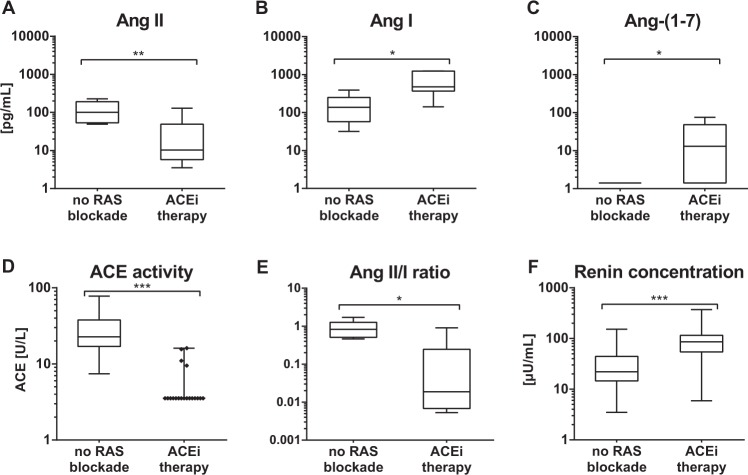
Figure 1.
Plasma equilibrium Ang levels. Plasma equilibrium Ang II (A), Ang I (B) and Ang-(1–7) (C) levels were measured in patients without RAS blockade and with ACEi therapy (n = 6 per group). Additionally, ACE activity (D), Ang II/Ang I-Ratio (E) and renin concentration (F) were analyzed in the respective patient groups. Horizontal bars represent median values. Lower limit of quantification: LLOQ. (1 pg/mL (Ang II), 1.3 pg/mL (Ang I), 2 pg/mL (Ang-(1–7)), 5 U/L ACE-acitvity, 1µU/mL (renin)). Time after transplantation (no RAS blockde median 3.0 [0.5–12.6] vs ACEi therapy 7.0 [1.9–13.3]). *P ≤ 0.05, **P ≤ 0.01, ***P ≤ 0.005.

