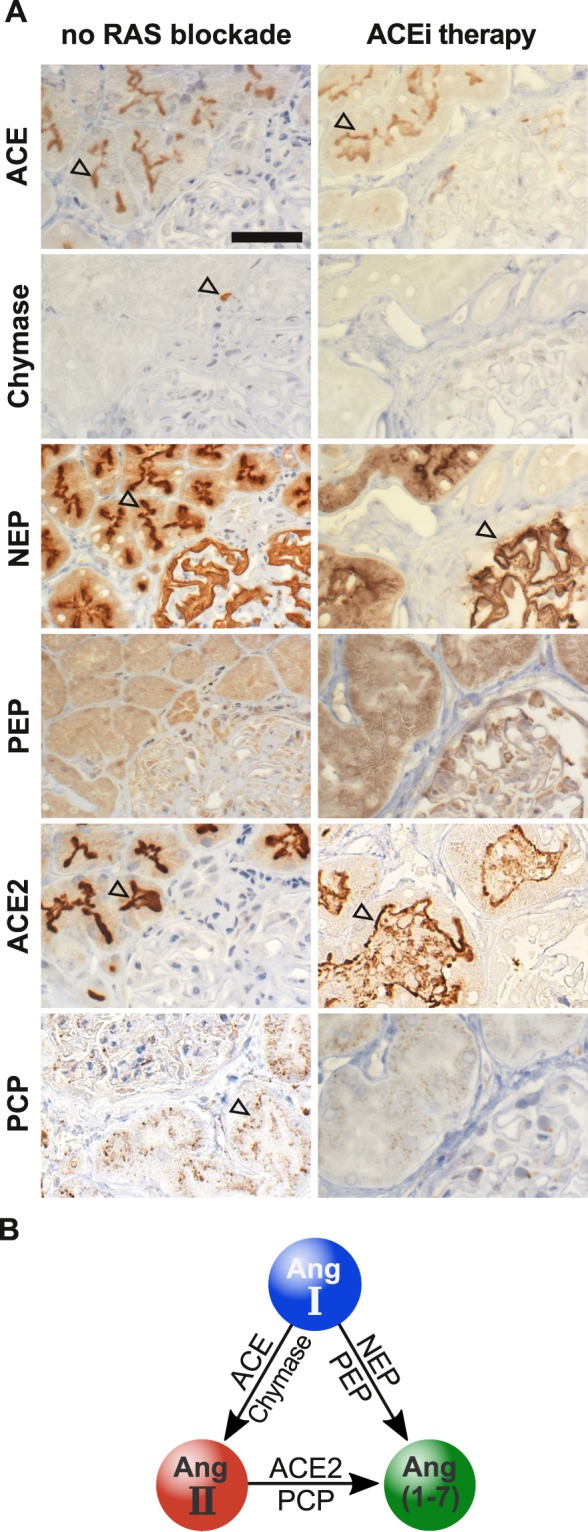
Figure 2.

Intrarenal Ang II and Ang-(1–7) forming RAS enzymes. Representative IHC stainings of RAS enzyme expressions of ACE, chymase, NEP, PEP, ACE2 and PCP in kidney biopsies of early biopsy groups with no RAS blockade and with ACEi therapy. (A) No differences in immunohistologic expression patterns were observed between different time periods after transplantation except higher incidence of chymase bearing mast cells. Black arrowheads indicate the respective enzymes or cells containing specific enzymes (chymase in mast cells) of representative biopsies. Scale bar equals 50 µm; 400× magnification. Simplified scheme of enzymatic Ang II and Ang-(1–7) synthesis from Ang I and Ang II, respectively (B).
