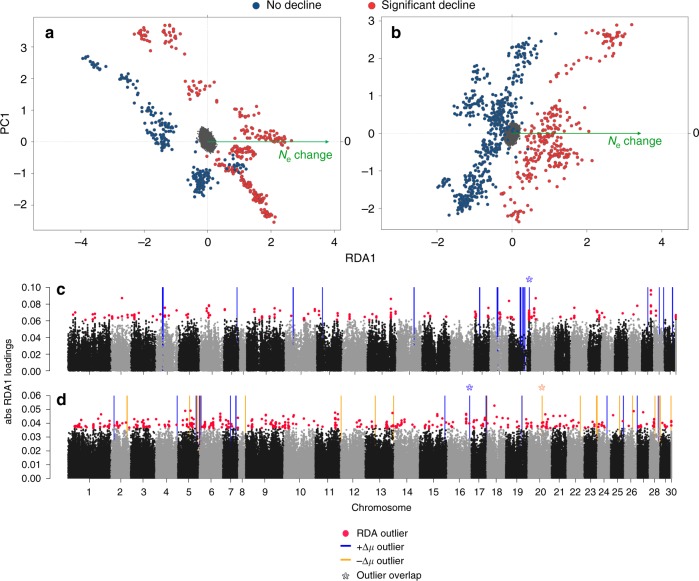
Fig. 3.
Genomic basis of population declines across Atlantic salmon using high-density genomic dataset. Redundancy analysis (RDA) separated significantly declining (red) and non-declining (blue) populations along the first axis in (a) North America and (b) Europe. Absolute RDA1 scores are presented in Manhattan plots for both continents (c, North America; d, Europe) with decline-associated loci (outliers) highlighted in red. Coloured lines represent regions showing significant changes in selective sweeps (∆µ) between declining and non-declining populations, where blue lines (+∆µ outlier) suggest an absence of selective sweeps in declining populations and orange lines (−∆µ outlier) suggest the presence of selective sweeps associated with declines. Asterisks (*) indicate regions with overlap between ∆µ and decline-associated SNPs (RDA) within each continent. SNPs on chromosome 30 represent those that did not align to known positions in the genome

