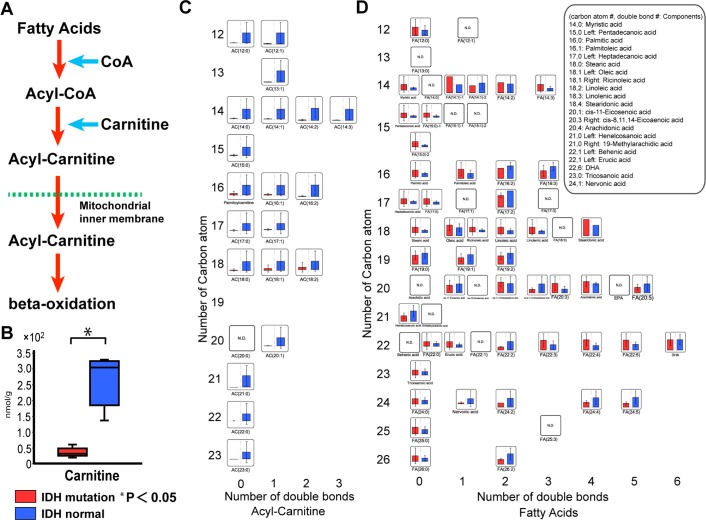
Figure 4.
Analysis of carnitine and lipid metabolism in IDH mutation gliomas. (A) Schematic of the β-oxidation pathway: the lipid metabolism pathway. (B) Carnitine was reduced in the IDH mutant glioma group (red bars). The vertical scale shows the absolute quantification (nmol/g). (C) Acyl-carnitine was reduced in the IDH mutant glioma group (red bars). (D) Fatty acids were not obviously elevated in the IDH mutant glioma group (red bars). In graphs C and D, the vertical scales showed the number of carbon atoms. The horizontal axis scale shows the number of double bonds. The vertical scale shows the relative quantification based on the internal standard. Red bars, IDH1R132H glioma; blue bars, normal IDH1 glioma; N.D., not detected; error bar, standard error of mean. *P < 0.05.

