Fig. 1.
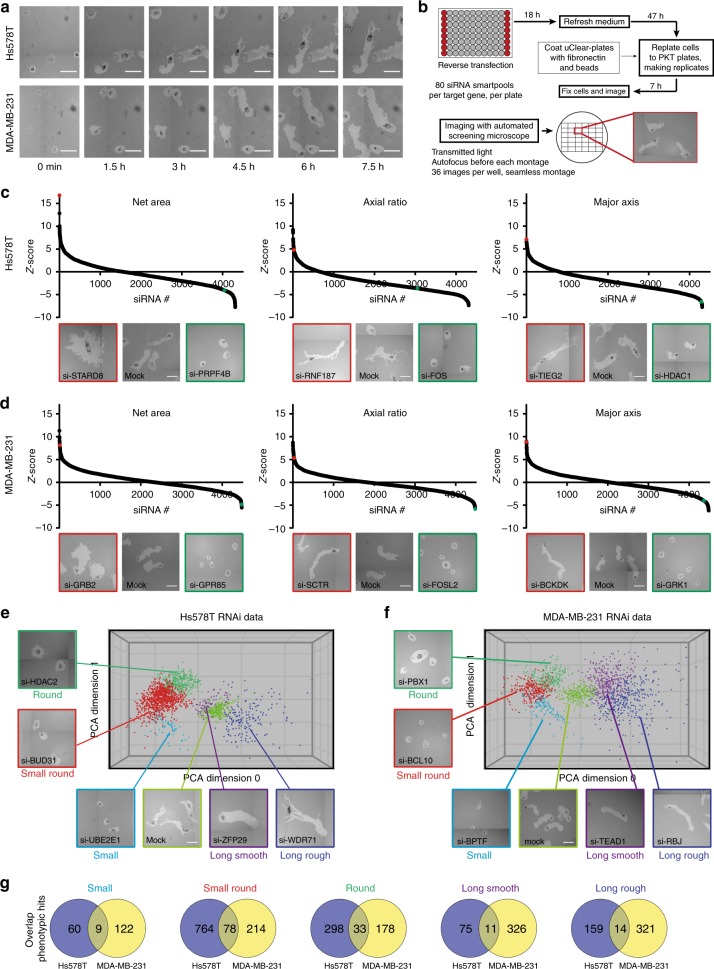
A phenotypic, imaging-based, RNAi screen identifies regulators of tumor cell migration. a Live cell imaging of Hs578T and MDA-MB-231 phagokinetic tracks. Scale bar is 100 µm. b Schematic representation of PKT screen. Transfection was performed in 96-well plates and controls were included in each plate. After 65 h, transfected cells were washed, trypsinized, diluted and seeded in PKT assay plates. Plates were fixed after 7 h of cell migration and whole-well montages were acquired using transmitted light microscopy. For each siRNA knockdown, a robust Z-score was calculated for each PKT parameter. All screening experiments were performed in technical and biological duplicates. c The three most dominant quantitative PKT parameters are shown for Hs578T, and d MDA-MB-231. Representative images of migratory tracks for genes with strong effect are shown below each graph and highlighted for enhancement (red) and inhibition (green). e Principal component analysis of migratory phenotypes in Hs578T, and f MDA-MB-231. Migratory phenotypes were identified manually and corresponding Z-scores were determined (see the methods section for more details). Only hits in each phenotypic class and mock control are plotted, and representative images of each phenotype are shown. g Overlap of hits in each phenotypic class in both Hs578T and MDA-MB-231

