Fig. 1.
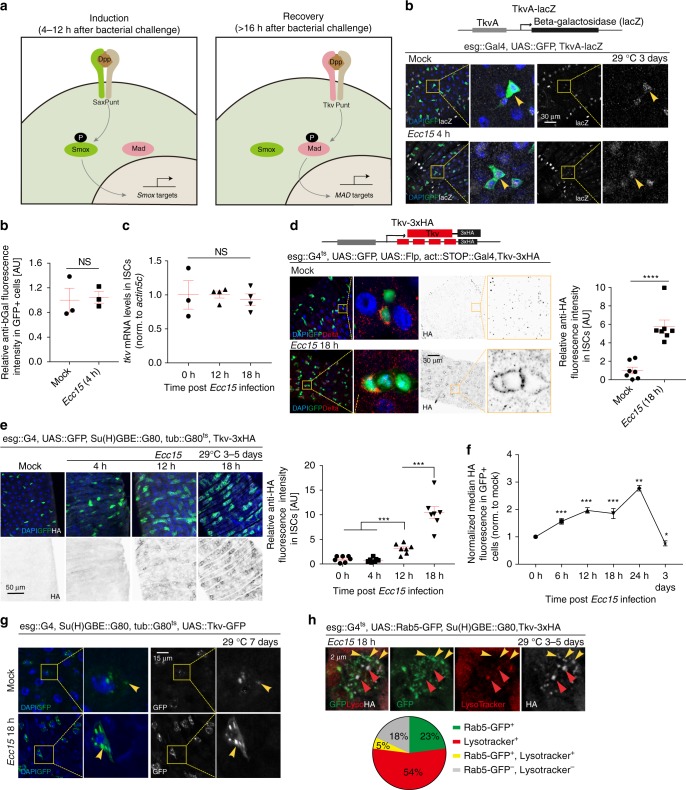
Tkv is induced and internalized in ISCs in response to Ecc15 infection. a Model for the dynamic control of ISC activity by temporal regulation of Sax/Smox signaling and Tkv/Mad signaling in ISCs in response to infection or tissue damage. b Cartoon depicting the gene structure of TkvA-lacZ flies. Transcription from tkv promoter in ISCs (green, arrowheads) under homeostatic conditions (mock) and 4 h after Ecc15 infection. c qPCR analysis of tkv mRNA level in ISCs under mock conditions and after Ecc15 infection (normalized to actin5c). d Cartoon depicting the gene structure of Tkv-3xHA flies. Tkv-3xHA protein was detected within ISCs (esg::Gal4, UAS::GFP, green; Delta+, red) and ISC-derived daughter cells (GFP+, DELTA−), in posterior midgut (PM) of flies at 18 h after Ecc15 infection, determined by immunohistochemistry with rabbit anti-HA antibody. Average HA fluorescence intensity in Delta+ cells was normalized to the mean value of mock. e Time-dependent induction of Tkv in ISCs, measured as the average intensity of Tkv-3xHA in ISCs per PM during the course of a 18 h Ecc15 infection (normalized to the mean value of 0 h). f Median fluorescence of Tkv-3xHA in GFP + ISCs during the course of a 24 h Ecc15 infection, as measured by intracellular Flow Cytometry analysis(normalized to the median value of control samples at 0 h collected on the same day of measurement). g, h Overexpressed Tkv-GFP fusion protein (g) or endogenous Tkv-3xHA protein (h) present as puncta in ISCs (GFP+). Tkv-3xHA puncta, detected by rat anti-HA antibody (used in the rest of our study), corresponded to Rab5+ early endosomes (green, yellow arrowheads) and lysosomes (red, red arrowheads), quantification of which were from single slice images (n = 101 cells from 7 guts) in h. Gain was increased for mock (g) for better visualization. Error bars indicated SEM (b n = 3 flies, d n = 7 flies, e n = 7 flies, f n = 447, 327, 3429, 1713, 1501, 1850, 1884, 2503 cells for 0 h samples; n = 2926, 2450, 1731, 727, 907, 792, 1049 cells for 6 h samples; n = 7230, 2880, 5792, 1209, 1539, 1798, 1636 cells for 12 h samples; n = 2901, 1466, 496, 943, 725, 891 cells for 18 h samples; n = 846, 1319, 1526, 725, 1490 cells for 24 h samples; n = 1148, 4492, 2098, 1954, 2357, 2542, 2666 cells for 3d samples). P values from Student’s t-test (b–d, e) or from one-tailed Wilcoxon rank-sum test (f): ****P < 0.0001; ***P < 0.001; **P < 0.01; *P < 0.05; NS, not significant. Experiments were repeated 3 times (d, e, g, h)

