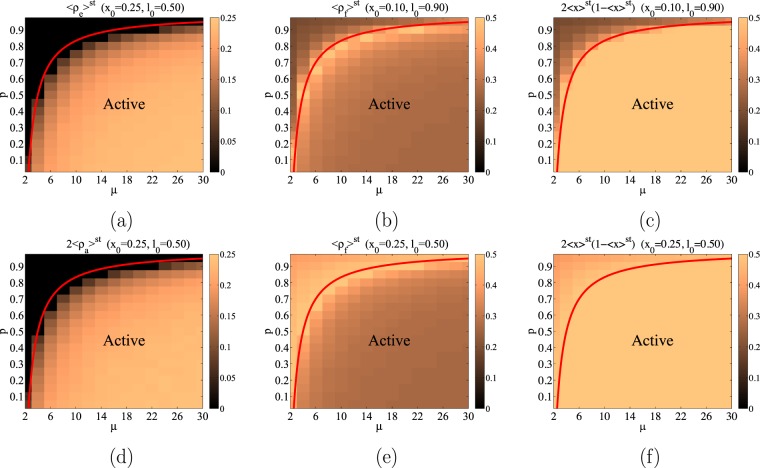
Figure 4.
These figures plot in a color code the density of links obtained from Monte Carlo simulation as a function of μ and p. The critical line obtained from the rate equations is plotted as a red line. As it can be seen, the values of displayed in panel (a) and in panel (d) are indistinguishable as it was predicted by Eqs (2 and 3), namely /2 in the active phase and in the frozen phase. Panels (b and e) represent for different initial conditions, confirming that in the frozen phase (above the critical line) the density of unsatisfying pairs depends on the initial condition, while in the active phase (below the critical line) they are independent of the initial condition. Finally, based on Eq. (1), the rate equations predict that the relation should hold in the frozen phase as it is indeed the case: compare, above the critical line, panels (c and b) for one initial condition and panels (e and f) for a different one.

