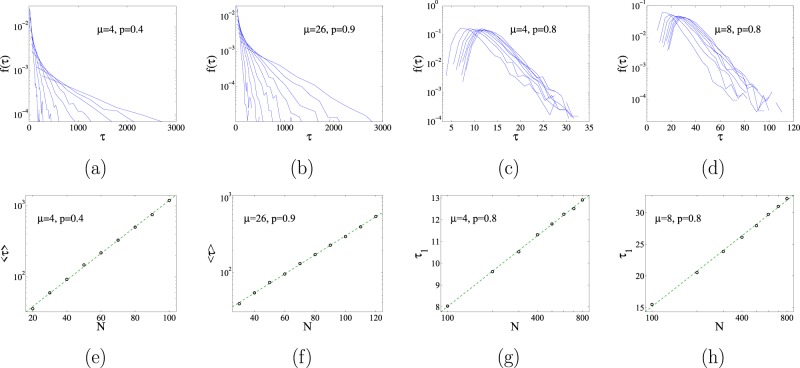
Figure 8.
In panels (a and b) we plot the probability density function of the characteristic time to decay to the frozen state, for two different sets of parameters belonging to the active phase, and for different system sizes. The corresponding mean values of the distributions, are displayed as a function of system size in panels (e and f), showing an exponential form, . Panels (c and d) plot for two different sets of parameters belonging to the frozen phase. These distributions have well defined maximum located at . The dependence of as function of system size are plotted in panels (g and h) displaying a logarithmic behavior, .

