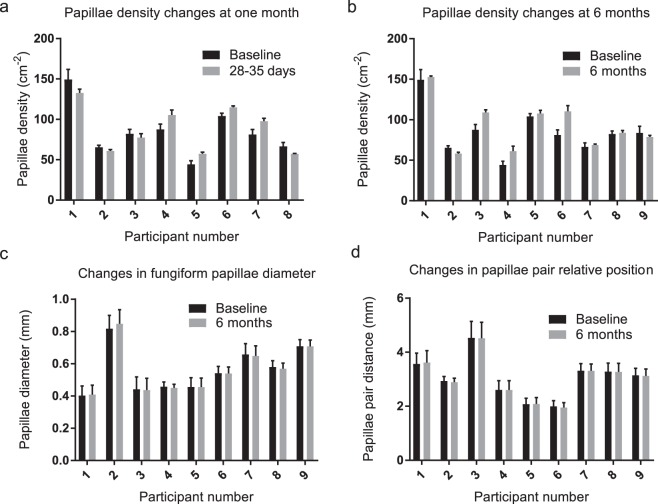
Figure 1.
Mean papillae density (±s.e.m.) based on three counts of the same image by a single operator at one month (3a) and six months (3b) from baseline. The different participant numbers are due to participant drop-out. No significant differences in papillae density were observed at one or six months (Wilcoxon signed-rank test, p = 0.54 and 0.20, respectively). (c,d) Show data for papillae diameter and relative position at baseline and six months for nine individuals, (n = 10 measures per participant at each time point). Two-tailed paired t-test revealed no significant differences in diameter (p-value range 0.32–0.95) or papillae position (p-value range 0.15–0.94).

