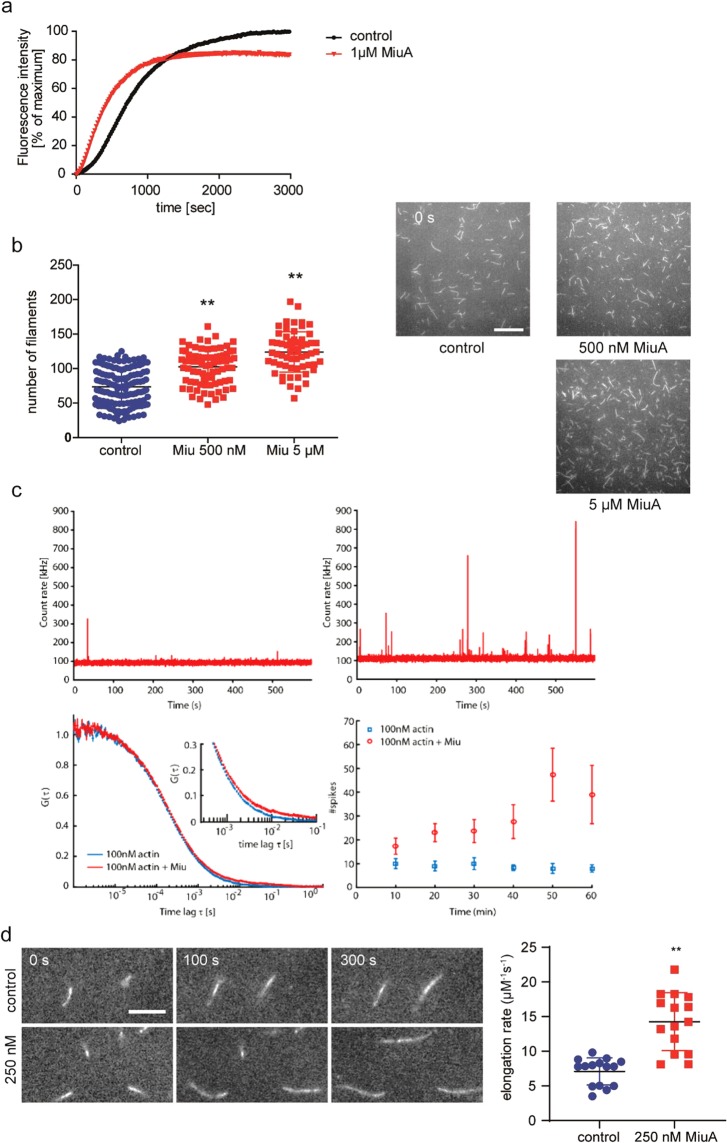
Figure 4.
MiuA enhances actin polymerization and nucleation. (a) The pyrene assay shows an accelerated polymerization of actin after treatment with MiuA. (b) The TIRF assay shows increased number of filaments indicating more nucleation of actin upon addition of MiuA. 138 frames (control), 81 frames (MiuA 500 nM), and 60 frames (MiuA 5 µM) respectively from 3 independent experiments were evaluated. In (a) and (b) the final concentration of G-actin was 1 µM. (c) Measurement of actin nucleation by FCS: The fluorescence signal of 100 nM actin-atto488 as a function of time after 1 h incubation, without (upper left panel) and with (upper right panel) 10x molar excess of MiuA. Lower left: FCS curves of 100 nM actin-atto488 with and without MiuA. Inset: detail of the autocorrelation function at longer timescales showing the formation of larger oligomers with MiuA. Lower right: Number of spikes due to filaments diffusing through the observation volume in 10 min time intervals. The data show that up to 6 times more spikes are observed during the course of one hour in the presence of MiuA. Error bars represent the standard error of the mean of three independent measurements. (d) Actin elongation measured using TIRF microscopy. Left panel: Representative time series of fluorescence images show the elongation of actin filaments. Right panel: The calculated actin elongation rates from 15 control and 15 MiuA treated filaments (n = 3 independent experiments). Scale bar in (b) represents 15 µm. Scale bar in (d) represents 5 µm. (Kruskal–Wallis test with Dunns test as post hoc, **P < 0.01 vs. control).

