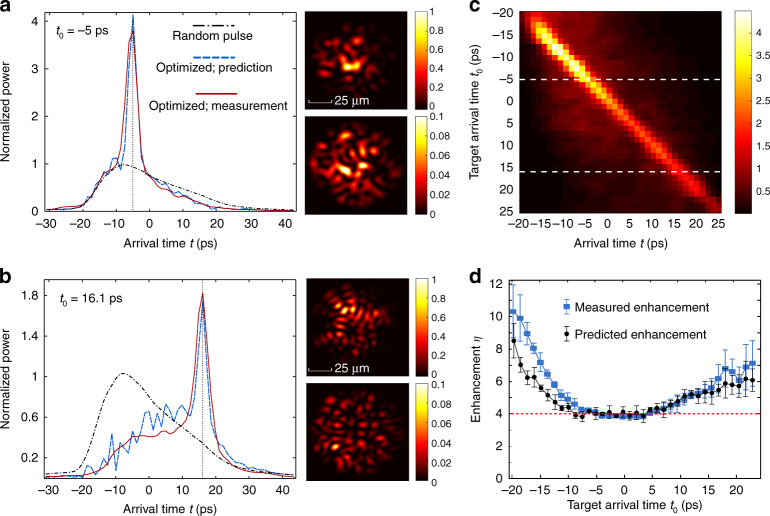
Fig. 3.
Enhancing transmitted power at selected time. a, b Temporal shapes of the output pulse when the spatially integrated intensity (power) is optimized at arrival time (a) t0 = −5 ps and (b) t0 = 16.1 ps. Red solid lines are the measured pulse shapes with optimized input wavefronts, the blue dotted lines are predicted from measured correlations C2(t, t′). They exhibit strong enhancement compared to the mean eigenvalues of , which represents the mean output pulse shape for random input wavefronts (black dash-dotted lines). Transmitted powers are all normalized by the peak power of the transmitted pulse with random input wavefronts. The insets are spatial intensity patterns at t0 for the optimized wavefront (upper panel) and a random wavefront (lower panel). The speckle grains at t0 = −5 ps are larger than those at t0 = 16.1 ps, due to larger contributions from the lower-order modes at earlier arrival time. c Temporal shapes of pulses optimized at different t0, ranging from −20 ps to 25 ps. The target time of a and b are marked by the white dashed lines. d Enhancement factor η of the transmitted power at the target arrival time t0. Blue squares: measured enhancement. Black circles: enhancement predicted from C2(t). Error bars represent the standard deviation among four measurements of the fiber in different bending configurations. Red dashed line indicates four times enhancement if C2(t) = 0

