Fig. 1.
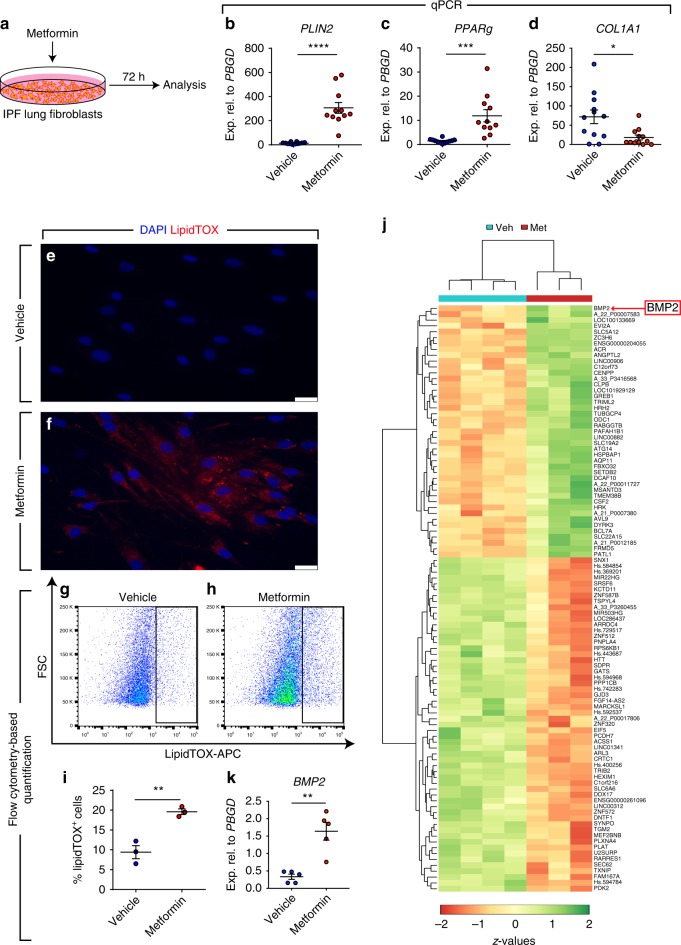
Metformin induces lipogenic marker expression in human IPF lung fibroblasts. a Schematic representation of the experimental setup. b–d qPCR analysis for the lipogenic marker genes PLIN2 and PPARg, as well as the myofibroblast marker COL1A1 in human IPF lung fibroblasts treated with metformin or vehicle. e, f Staining of lipid droplets in fibroblasts using LipidTOX (red). Nuclei were counterstained with DAPI (blue). g–h Gating strategy for detecting LipidTOX+ cells by flow cytometry. i Quantification of LipidTOX+ cell abundance in response to metformin treatment. j Heatmap representation of the top 100 differentially expressed genes in fibroblasts following metformin treatment. k qPCR analysis for BMP2 in metformin- and vehicle-treated cells. Scale bars: e, f 25 µm. Each data point within a given group corresponds to one patient and error bars indicate s.e.m. b–d Vehicle-treated group: n = 12, Metformin-treated group: n = 11. i n = 3 per group. k n = 5 per group. Student’s t-test was used in (b–d) and Mann–Whitney test was used in (i, k). *P < 0.05, **P < 0.01, ***P < 0.001, ****P < 0.0001

