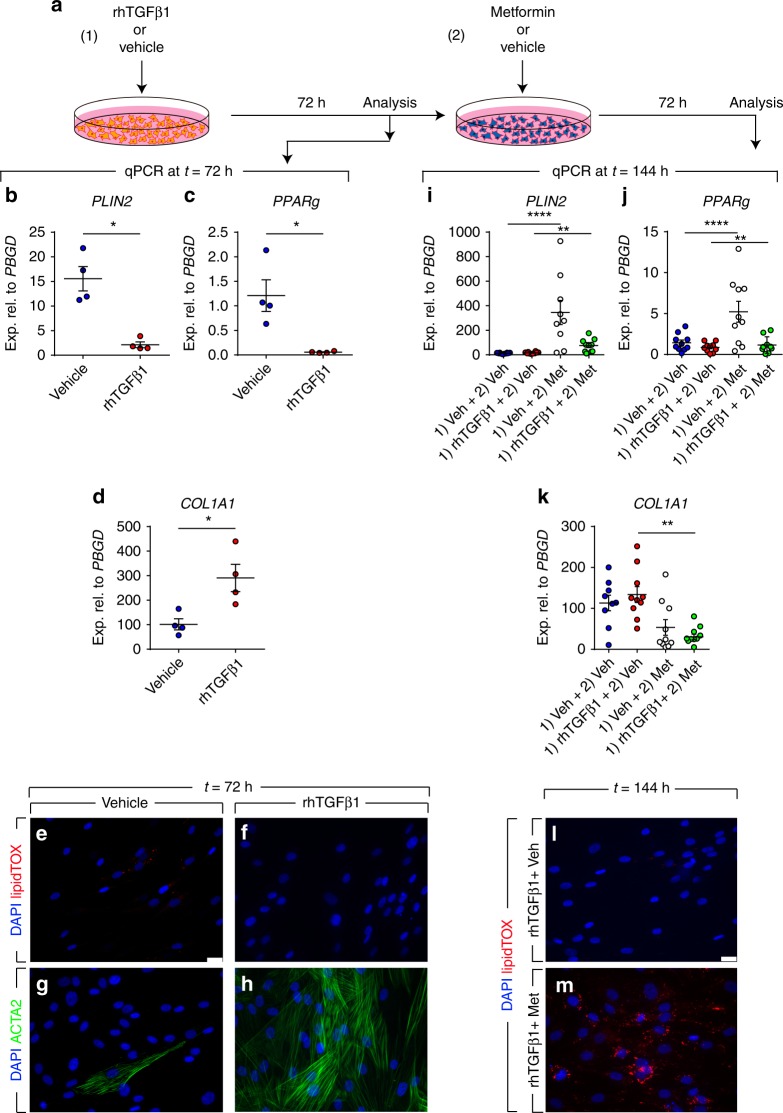
Fig. 2.
Metformin attenuates TGFβ1-mediated fibrogenesis in vitro. a Schematic representation of the experimental setup. b–d qPCR analysis for PLIN2, PPARg, and COL1A1 in human lung fibroblasts treated with TGFβ1 or vehicle for 72 h. e–h Staining of TGFβ1- and vehicle-treated cells with LipidTOX (red), anti-ACTA2 antibodies (green), and DAPI (blue). i–k qPCR analysis for PLIN2, PPARg, and COL1A1 in human lung fibroblasts treated with TGFβ1 or vehicle for 72 h, followed by treatment with metformin or vehicle for 72 h. l, m Staining of TGFβ1- and vehicle-treated cells with LipidTOX (red) and DAPI (blue) at the end of treatment (t = 144 h). Scale bars: (e–h) and (l, m) 25 µm. Each data point within a given group corresponds to one patient and error bars indicate s.e.m. b–d n = 4 per group. i–k n = 9–10 per group. Mann–Whitney test was used in (b–d), one-way ANOVA was used in (i, j) and Kruskal–Wallis test was used in (k). *P < 0.05, **P < 0.01, ****P < 0.0001. Met: metformin, Veh: vehicle

