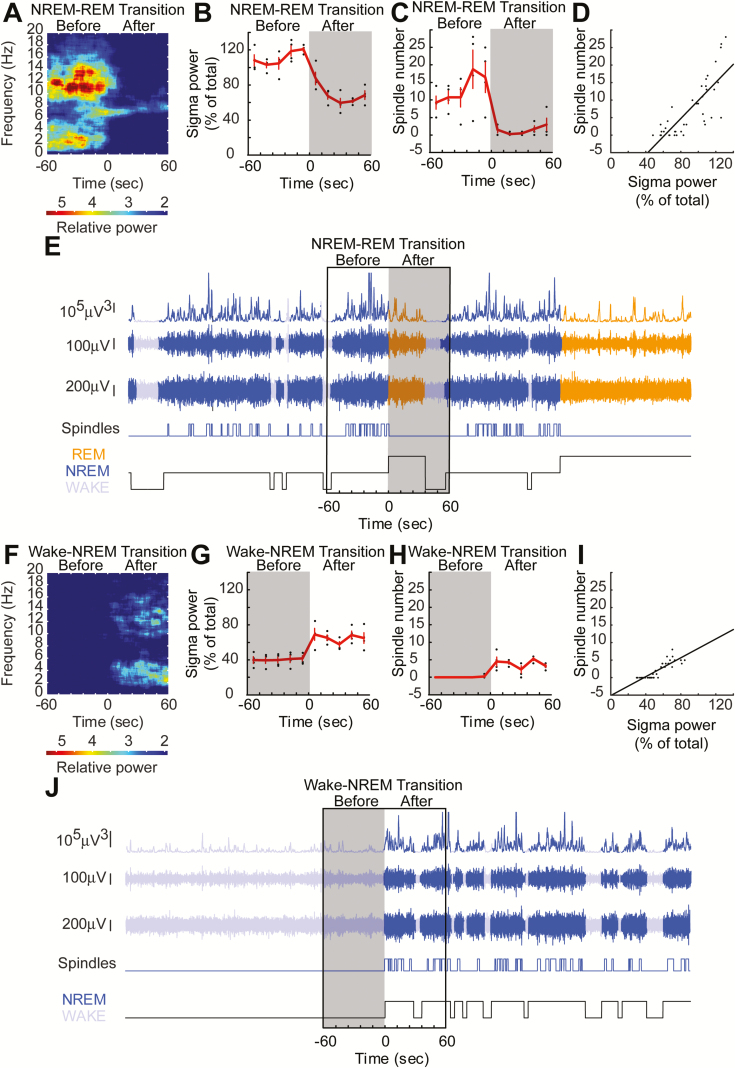
Figure 3.
Automated spindle detection correlates with sigma-power (10–15 Hz) at sleep-wake transitions. (A) Sigma-power (10–15 Hz) surges can be observed prior to NREM–REM state transitions. Theta band (5–9 Hz) power increases prior to NREM–REM transitions and continues on into REM sleep. Spectrogram at NREM–REM transition. (B) Sigma-power surges can be observed at NREM–REM state transitions, calculated as previously described [29]. (C) Spindle numbers aligned at the same periods as shown in (A) followed a similar trajectory. (D) Spindle number correlated with the sigma-power surge. (E) Example stretch of EEG data showing that many detected spindles occur outside of the state-transition window. (F–J) The same comparisons are depicted for wake–NREM transitions showing that spindle number correlates highly with sigma-power.

