Figure 4.
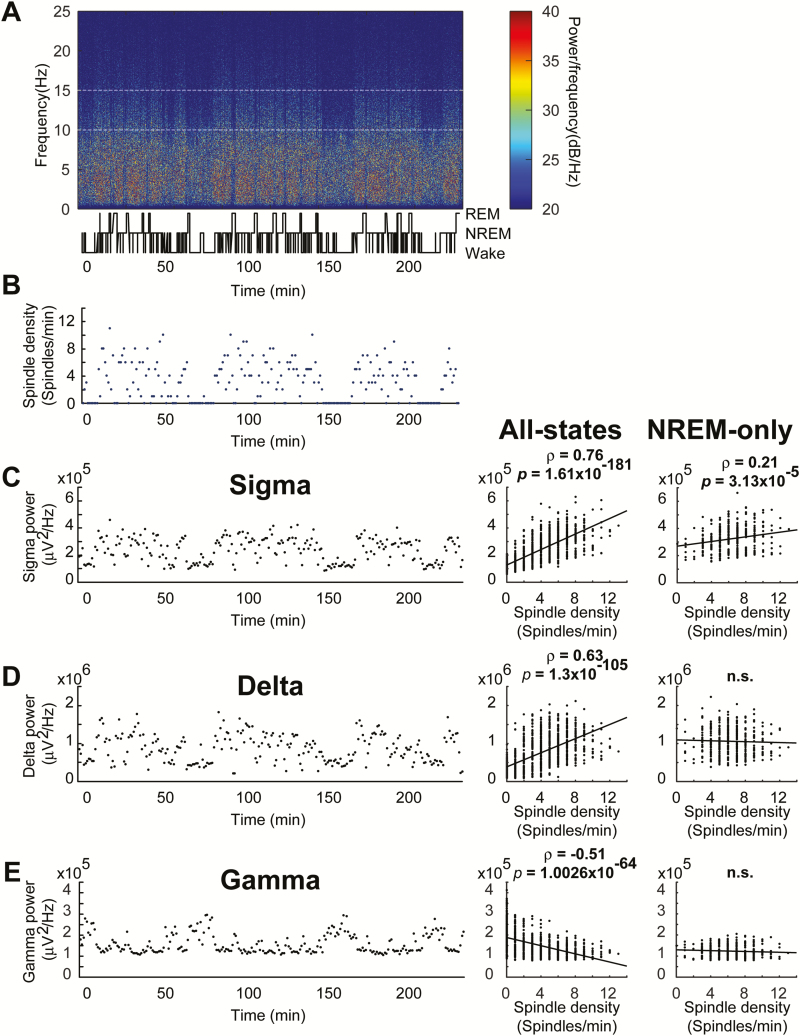
During NREM sleep, spindle density correlates with sigma-power, but not with delta or gamma-power (right column of C–E). (A) Representative spectrogram with temporally aligned hypnogram shows the gross mouse sleep-wake patterns across the 4-hour recording period. (B) The number of NREM-spindles (blue) in each 1-minute block from the same representative case across the 4-hour recording is depicted; spindles occurring in REM or wakefulness are omitted. (C, D, E Left) Absolute sigma-power (C), delta-power (D), and gamma-power (E) in 1-minute blocks from a representative case are depicted. (C Middle) Spindle density (3.4 ± 0.1 spindles/minute) and sigma-power correlated in four animals. (C Right) Spindle density (6.3 ± 0.1 spindles/minute) and sigma-power correlated when only NREM was considered in four animals. (D Middle) Spindle numbers and delta-power were correlated in four animals. (D Right) Spindle numbers and delta-power were no longer correlated when only NREM was considered in four animals. (E Middle) Spindle numbers and gamma-power were negatively correlated in four animals. (E Right) Spindle numbers and gamma-power were no longer negatively correlated when only NREM was considered in four animals.

