Figure 1.

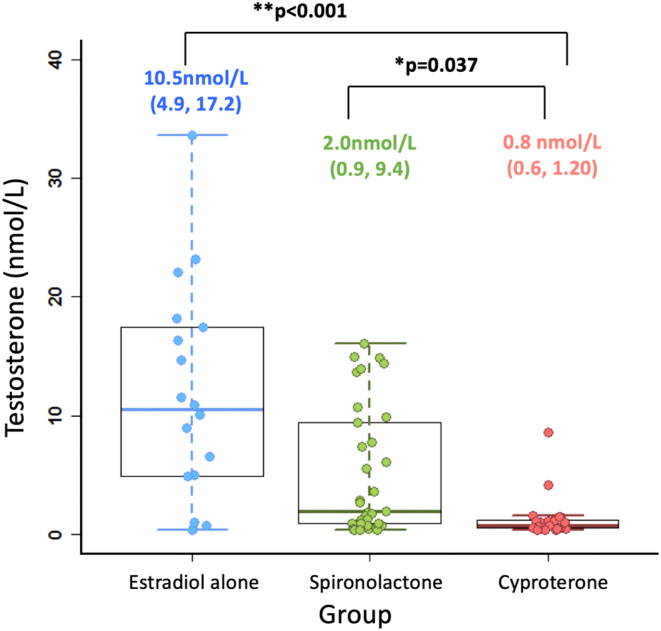
Box plots demonstrating median, interquartile range and range for total testosterone (nmol/L) for three groups. The median (IQR) is printed above and P values represent comparison with cyproterone acetate group.

Box plots demonstrating median, interquartile range and range for total testosterone (nmol/L) for three groups. The median (IQR) is printed above and P values represent comparison with cyproterone acetate group.