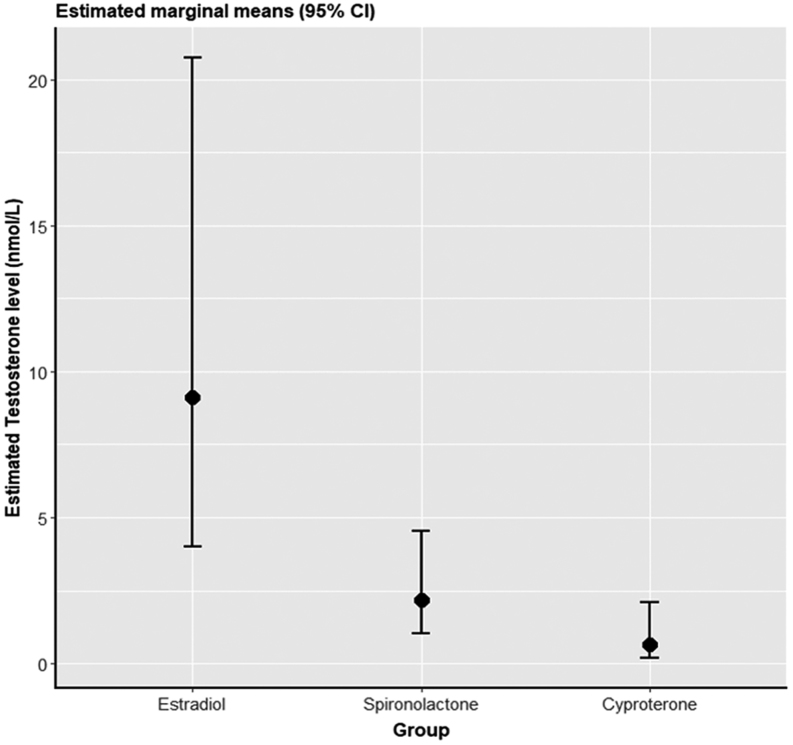
Figure 2.
Estimated marginal means (95% CI) for the three groups from a linear mixed model adjusting for oestradiol concentration, oestradiol dose, spironolactone dose, cyproterone dose and age, with recruitment centre as random effect. Total testosterone concentrations were back-transformed to show the geometric mean of each group.

 This work is licensed under a