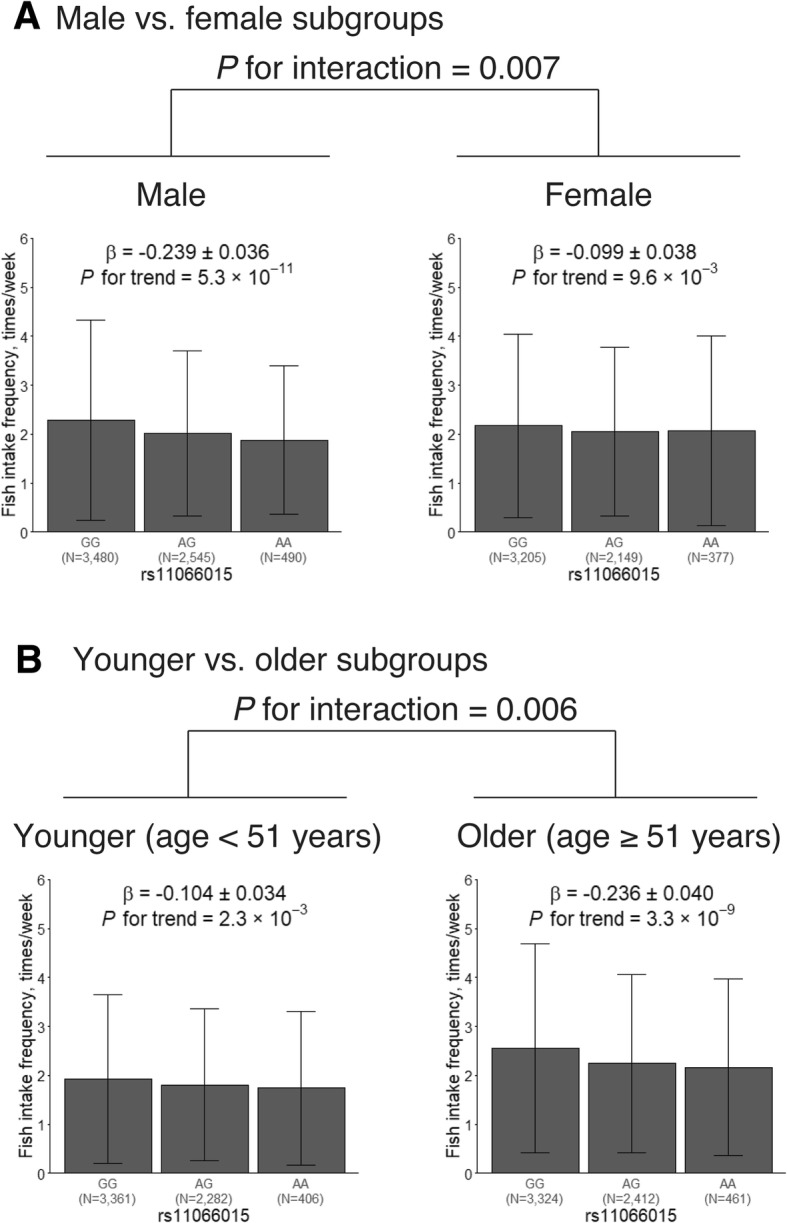
Fig. 3.

Subgroup analysis stratified by sex and age. The x-axis represents the genotype of the lead variant at 12q24 (rs11066015)—i.e., GG, AG, or AA—and the y-axis represents fish intake frequency in times per week. a Male vs. female subgroups. b Younger (age < 51 years) vs. older (age ≥ 51 years) subgroups
