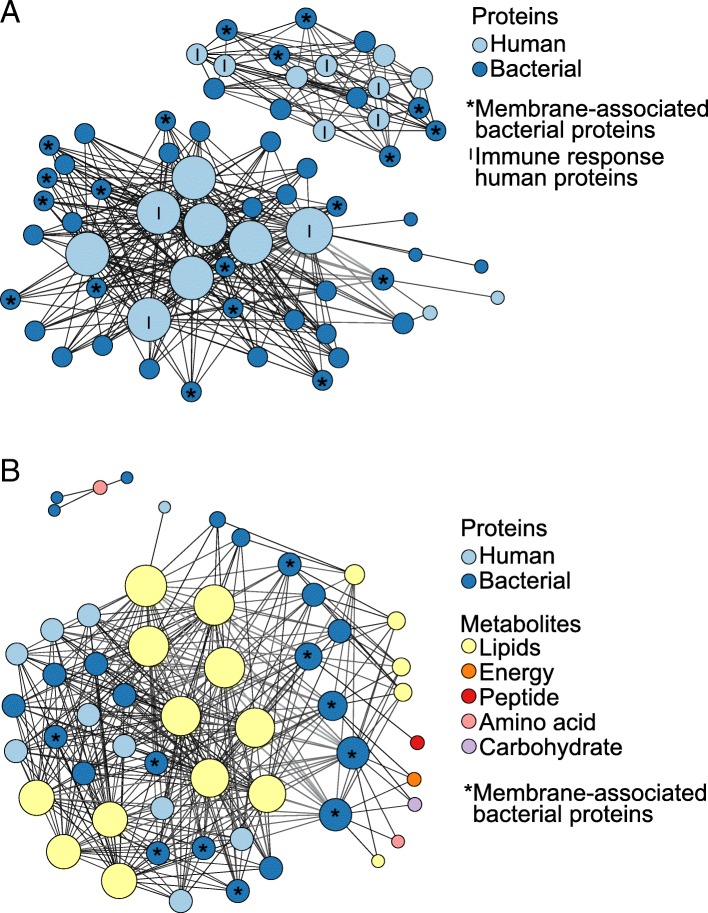
Fig. 9.
Canonical correlations between historic sample proteins and metabolites. The strongest canonical correlations in historic calculus are presented as network graphs where the nodes are proteins/metabolites and edges represent canonical correlations, with darker, thinner lines lower values and thicker, lighter lines higher values. Nodes are sized by the number of edges they have and are colored based protein on metabolite category. a Bacterial and human protein correlations ≥ 0.9. b All protein and metabolite correlations ≥ 0.9. Graphs with node names are included in Additional file 1: Figures S18-S19

