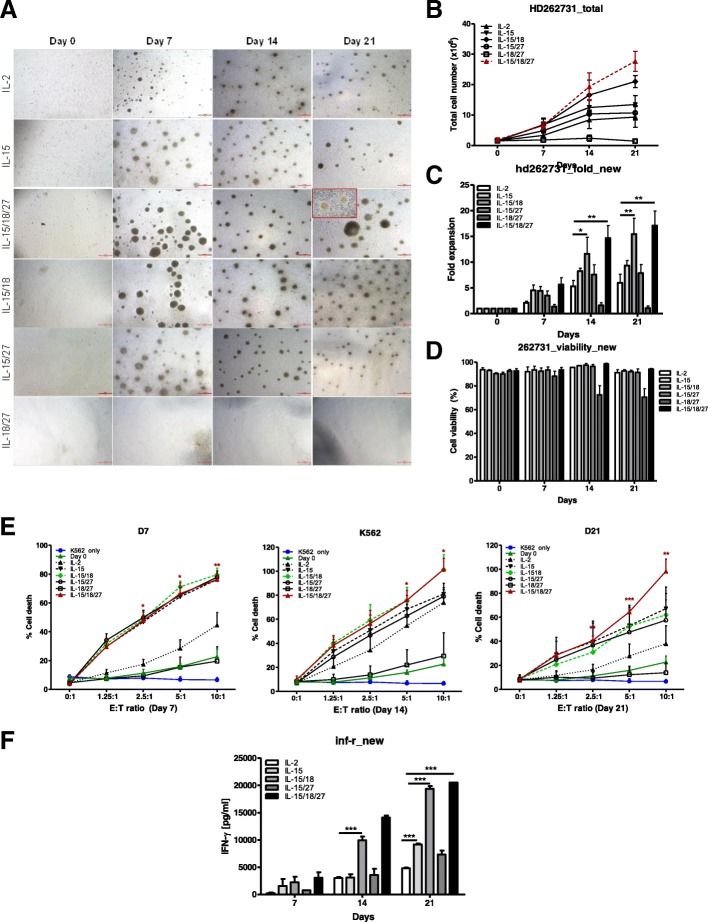
Fig. 1.
Cytokine regulation of the proliferation and cytotoxicity of primary NK cells. a CD3-CD56+ NK cells (0.6–1.8 × 10⁶ / well) isolated from PBMCs were cultured in the indicated cytokines for 21 days. Primary NK cells were imaged using an inverted microscope and counted. Representative images of aggregates of growing primary NK cells in different culture conditions. Bars represent 500 μm; original magnification × 40. b The graph represents the total NK cell number of each group. Symbols indicate cytokine treatment groups (n = 3 / group): IL-2 (▲), IL-15 (▼), IL-15/18 (◆), IL-15/27 (○), IL-18/27 (□), and IL-15/18/27 (red). c. Fold expansion of NK cell numbers compared with those on day 0 following culture of CD3-CD56+ NK cells with the indicated cytokines. The graphs show the mean ± SD. * P < 0.05, ** P < 0.01, and *** P < 0.001, compared with day 0. d NK cell viability. The viable cell numbers were determined by trypan blue staining on days 7, 14 and 21. * P < 0.05, compared with day 14. e NK cytotoxicity assays of various cytokine-stimulated NK cells with K562 target cells on days 7, 14 and 21. The E:T ratios ranged from 0:1 to 10:1. After 4 h of incubation at 37 °C, the lysis of target cells was measured by ELISA. E:T indicates the effector-to-target ratio. The cytolytic activity of human NK cells stimulated with IL-15/18/27 toward K562 cells was significantly increased (*P < 0.05, **P < 0.01, *** P < 0.001) compared with that of resting NK cells (day 0) at the same E:T ratio. f Supernatants were analyzed for IFN-ɣ secretion by ELISA. The data presented are the mean ± SD of three separate experiments., *** P < 0.001, compared with IL-2 treated group

