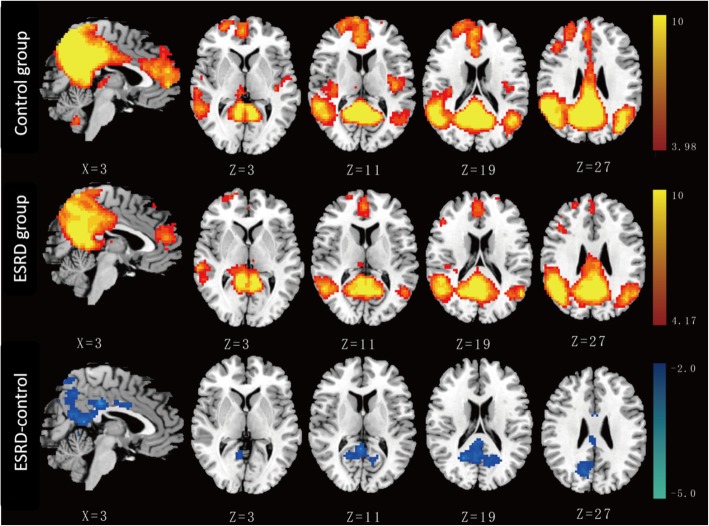
Fig. 1.
Group comparison based on component 3. The IC map of component 3 in the control group predominantly consisted of the PCC, precuneus, bilateral inferior parietal and MPFC (P < 0.001, AlphaSim corrected). Similar functional connectivity but with somewhat disrupted intrinsic connectivity in several DMN areas was found in the ESRD group (P < 0.001, AlphaSim corrected). The ESRD group showed significantly decreased connectivity in the PCC and the adjacent precuneus (P < 0.05, AlphaSim corrected, cluster size≥428 voxels) compared with the control group

