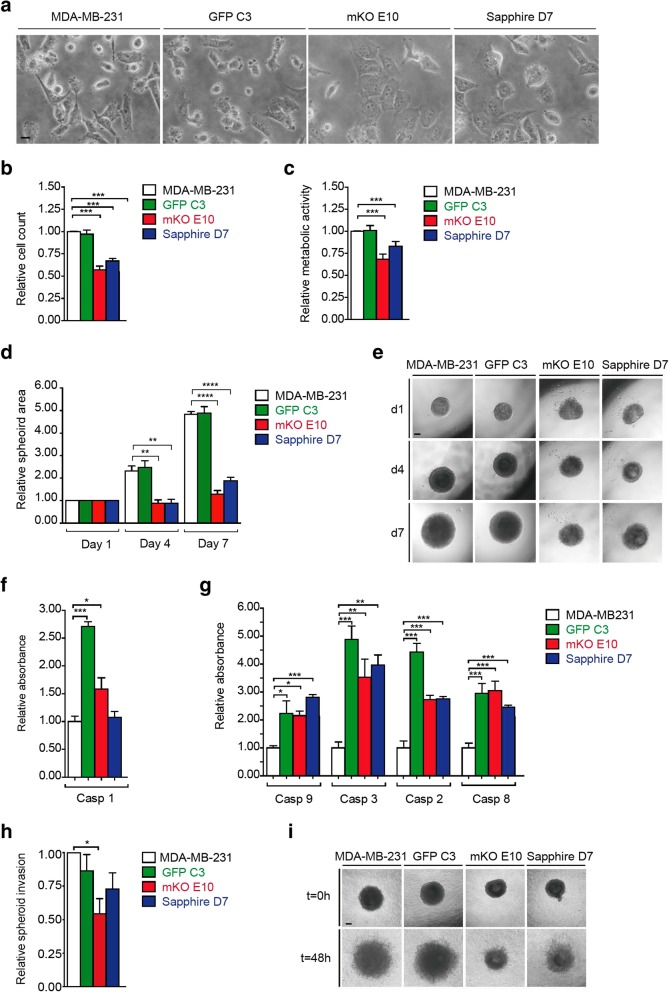
Fig. 1.
Phenotypic characterization of MDA-MB-231, GFP C3, mKO E10, and Sapphire D7 cell lines. a Morphological evaluation by phase contrast images (scale bar = 200 μm). b Cell count after 72 h in culture, relative to MDA-MB-231 count. c Metabolic activity rate: quantification of MTT metabolization by metabolically active cells, absorbance relative to MDA-MB-231. d-e 3D growth rate: spheroid area at days 1, 4 and 7, relative to MDA-MB-231-day 0 quantification (d) and representative pictures (scale bar = 250 μm) (e). f-g Apoptotic analysis: absorbance relative to MDA-MB231. Expression of Caspase 1 (f) and Caspase 9, 3, 2 and 8 (g). h-i 3D invasion by spheroid cell migration: relative invasion (h) and representative picture at 0 and 48 h (scale bar = 250 μm) (i). Significant differences were determined using unpaired t-test with Welch’s correction. Asterisks indicate significant differences when P-values are < 0.05 (*), < 0.01 (**), and < 0.001 (***)

