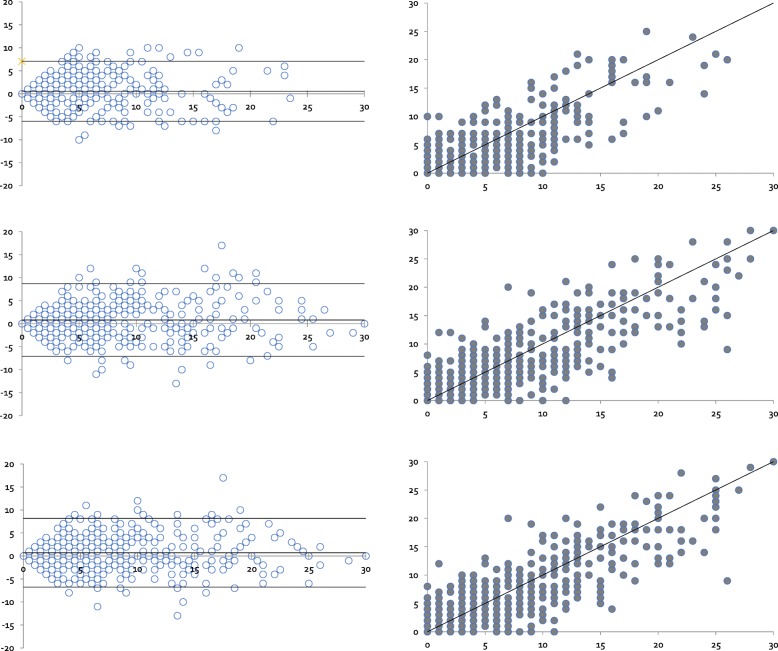
Fig. 1.
Bland-Altman plot of the distribution of the Doppler sum score, Global synovitis score (GLOESS) sum score, and grey-scale (GS) sum score for right and left hands. a Scatter plot: Doppler sum score ultrasound measured on the right and the left hand, with line of equality. b Bland-Altman plot: Difference against mean for Doppler sum score data. c Scatter plot: GLOESS sum score measured on the right and the left hands, with line of equality. d Bland-Altman plot: Difference against mean for GLOSS sum score data. e Scatter plot: GS sum score measured on the right and the left hands, with line of equality. f Bland-Altman plot: Difference against mean for GSUS sum score data

